RSSI to dBm Calculator
Convert raw RSSI readings, WiFi quality percentages, BLE values, and chipset-specific scales into practical dBm, SNR, link margin, and signal-quality estimates.
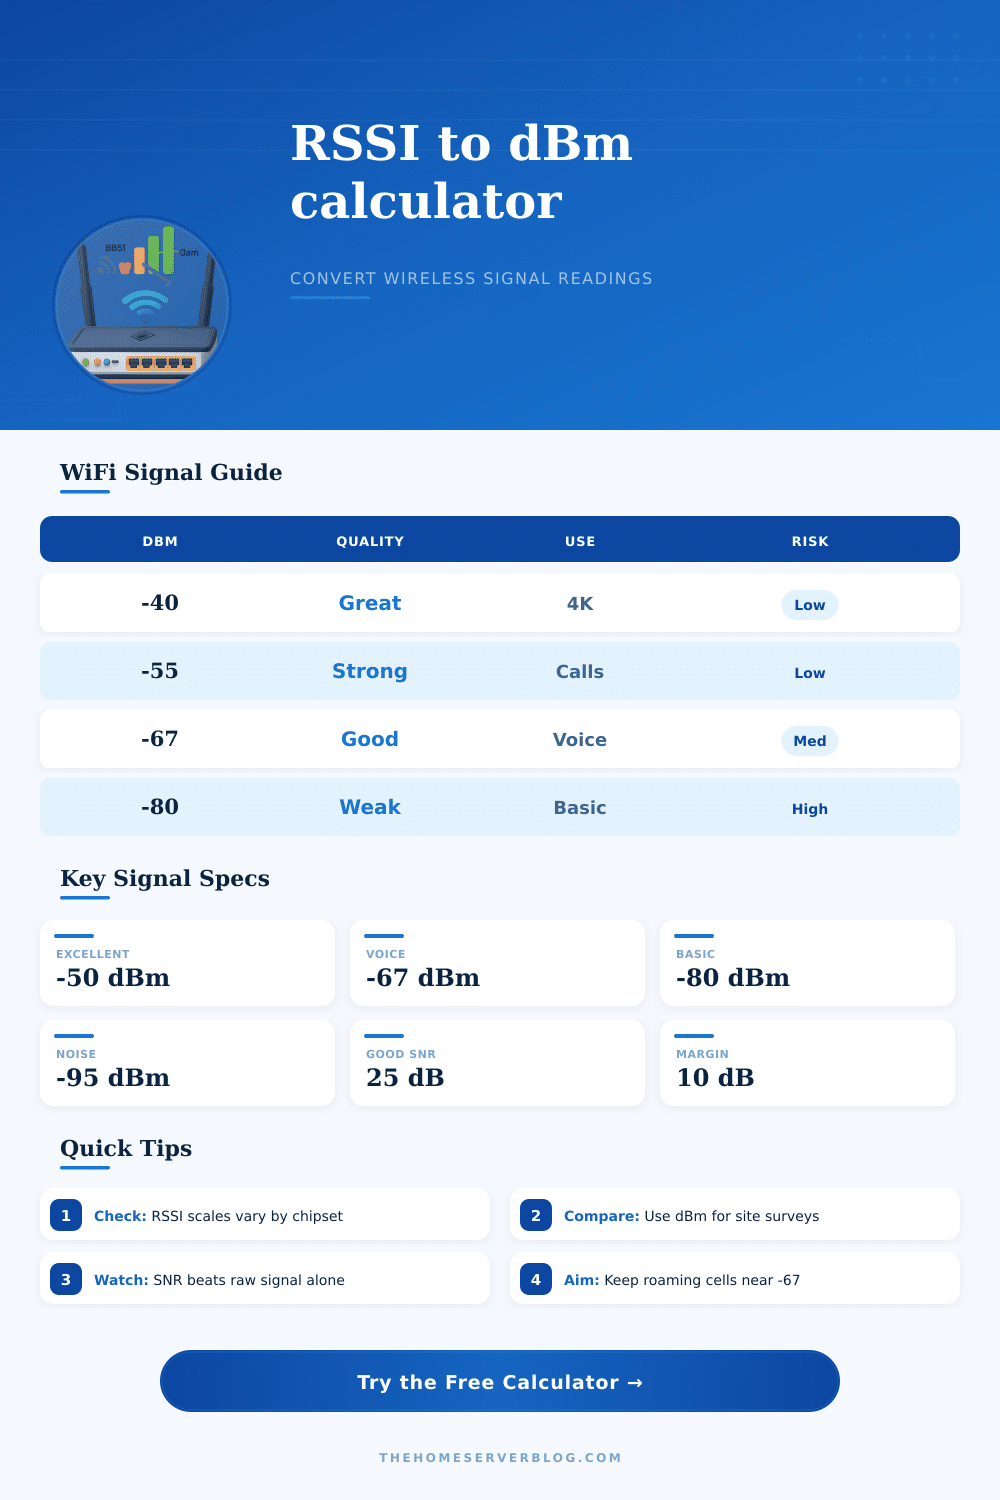
| Receive level | Typical quality | Practical use | Home lab note |
|---|---|---|---|
| -30 to -50 dBm | Excellent | High throughput, low retries | Usually same room or near AP |
| -51 to -60 dBm | Very strong | Video calls, backups, NAS work | Good primary workspace level |
| -61 to -67 dBm | Good | Voice, roaming, stable client access | Common enterprise design target |
| -68 to -75 dBm | Fair | Browsing, basic streaming | Watch retries and roaming stickiness |
| -76 to -85 dBm | Weak | Low-rate traffic only | May need AP placement changes |
| Below -85 dBm | Very weak | Unstable or disconnected | Often below reliable design range |
| Profile | Input range | Calculator mapping | When to use it |
|---|---|---|---|
| Already dBm | -100 to -20 | Value is used directly | Most WiFi scans, BLE logs, controller dashboards |
| Quality percent | 0 to 100 | dBm = percent / 2 - 100 | Linux wireless quality and many UI summaries |
| RSSI 0-100 | 0 to 100 | Linear between chosen low/high dBm | Routers that expose a positive signal score |
| Raw 0-127 | 0 to 127 | Linear between chosen low/high dBm | Chipset APIs and embedded wireless modules |
| Raw 0-255 | 0 to 255 | Linear between chosen low/high dBm | Older drivers, radio debug counters, SNMP exports |
| Custom linear | User-defined | Interpolates raw min/max to dBm min/max | When vendor documentation gives endpoints |
| Use case | Target dBm | Suggested SNR | Design note |
|---|---|---|---|
| IoT telemetry | -80 dBm | 10 dB+ | Low data rate devices can tolerate weaker links |
| General WiFi | -70 dBm | 20 dB+ | Good default for browsing and streaming |
| Voice roaming | -67 dBm | 25 dB+ | Keeps calls stable while moving between APs |
| High throughput | -60 dBm | 30 dB+ | Better for NAS transfers and large sync jobs |
| Wireless bridge | -55 dBm | 35 dB+ | Point-to-point links need extra fade margin |
Wireless signal strengths is measured using several different metric. Many peoples find these metrics to be somewhat confusing as different devices utilize different method of measuring signal strength. For instance, signal strength can be represented as a percentage, or it can be represented as an RSSI value.
RSSI isnt a universal standard of measurement. For instance, an RSSI value of seventy on one device may represent a strong signal to that device, but the same RSSI value on another device may represent a weak signal. To even compare signal strengths from different devices, you must first convert the signal strength to dBm.
dBm value provide a universal means of measuring signal strength.
How Wireless Signal Strength and Noise Affect Your Connection
However, dBm values by themselves dont provide you with an idea of whether the signal will be functional for your wireless device. You must also consider the noise floor. The noise floor is the level of electronic noise in your environment.
High signal strength can fail if the noise floor is high in your environment. To determine if your signal is functional for your device, calculate the Signal-to-Noise Ratio (SNR) of your signal. SNR is a calculation of the strength of the signal relative to the noise floor in your environment.
SNR values is important to ensure that your wireless device can distinguishes the signal from the noise. If the device cannot distinguish the signal from the noise, the wireless connection will not be stablely. The signal strength that is required for your wireless device to perform a certain task.
For instance, a small sensor does not require the same signal strength as a device that performs voice calls. A sensor transmits less data than a voice call, so it does not require as strong a signal. For instance, signal strength of around negative sixty-seven dBm is required for voice calls to allow devices to move between access points in an area without dropping the signal.
If signal strength is too low, the device will fail to connect to the wireless network. The physical obstacles that exist in the environment will cause the signal to decay. Signal decay occurs when walls, mirrors, and furnitures absorb or reflect the wireless signal.
You can use the path loss exponent to calculate the decay in signal strength away from the router. When planning your network, you should account for signal decay. To ensure that signal strength remains stable in your wireless network, even if the environment changes, you should also provide extra signal strength to the network, known as headroom.
By providing extra signal strength to the network, the wireless connection will remain stable even if the environment changes. The speed of the wireless network and the stability of the wireless network are two trade-offs for wireless network engineers. The wider the channels for the wireless network, the more data that can flow through the network.
However, wider channels allow more noise into the network. This means that the wider the channels for a wireless network, the higher the SNR value that is required for that network to remain stable. Engineers can use reference tables to determine the dBm and SNR values required for a wireless device and environment.
By focusing on the signal strength and noise floor of a wireless network, engineers can create a wireless network that is easily predictable instead of relying upon the signal bars that is displayed on the screen of each device.