HomeServerBlog application concurrency planner
Thread Pool Sizing Calculator
Estimate an executor or worker-pool size from CPU cores, target utilization, service time, blocking wait time, request rate, latency budget, stack memory, and context-switch overhead.
▣Thread pool presets
⚙Executor and workload inputs
Formula breakdown
Capacity signals
🖥Runtime and executor comparison grid
📊Calculated planning metrics
From cores x target utilization x wait/service ratio.
Target rate multiplied by latency budget.
Time to drain the configured queue at spare capacity.
Core utilization needed by requested task rate.
📘Reference tables
Pool sizing formulas
| Formula | Use | Inputs | Result |
|---|---|---|---|
| N = C x U x (1 + W / S) | CPU saturation with blocking | Cores, util, wait, service | CPU-balanced pool |
| L = lambda x latency | In-flight work target | Rate and P95 budget | Concurrency cap check |
| workers = lambda x task time | Throughput capacity | Rate, service, wait | Minimum busy workers |
| cap = memory / stack | Native memory ceiling | MB budget and stack MB | Hard thread ceiling |
| switch CPU = rate x switches x cost | Scheduler overhead | Rate, switches, microseconds | CPU lost to switching |
Workload pattern guidance
| Pattern | Wait ratio | Typical pool | Watch |
|---|---|---|---|
| CPU-bound compute | 0.0 to 0.3 | Cores to cores x 1.2 | Run queue and thermal throttling |
| Database API | 2 to 8 | Match DB connection budget | Pool larger than DB creates queues |
| File crawler | 4 to 20 | Disk and SMB limited | Metadata latency and open handles |
| Remote HTTP calls | 5 to 50 | Use timeout-bound pools | Retries can multiply concurrency |
| Job queue | 0.5 to 10 | Separate slow and fast queues | Long jobs starving short jobs |
Runtime memory and cap comparison
| Runtime | Worker unit | Usual cap driver | Practical note |
|---|---|---|---|
| Java platform thread | Native thread | Stack memory | Fixed pools are easiest to reason about |
| Java virtual thread | Virtual task | Carrier CPU | Still cap databases and remote services |
| .NET ThreadPool | Runtime worker | CPU and blocking | Measure starvation counters under load |
| Python ThreadPool | OS thread | GIL for CPU tasks | Use process pools for CPU-bound code |
| PHP-FPM | Child process | Resident memory | Use max children from measured RSS |
Common home lab thread pool sizes
| Project | Host | Starting pool | Secondary limit |
|---|---|---|---|
| Small REST app | 4 cores / 8 GB | 8 to 16 workers | DB connections 10 to 20 |
| Media metadata scan | 4 cores / NAS | 12 to 32 workers | Disk IOPS and SMB latency |
| Proxmox job runner | 8 cores / 32 GB | 8 to 24 workers | Storage queue depth |
| Home automation add-on | 2 cores / 2 GB | 4 to 10 workers | Memory and event loop lag |
| CI build dispatcher | 16 cores / 64 GB | 8 to 20 workers | RAM per job and disk temp space |
Thread pool math gives a starting value, not a final production limit. Validate the result with a short load test while watching CPU steal, run queue length, latency percentiles, memory RSS, blocked thread counts, and downstream pool saturation.
💡Thread pool sizing tips
Most developers treats thread pools like black boxes, which is something you should of not do. Set the size to ten or twenty; hope for the best; when the server starts dropping requests, do some head scratching. Until then, memory usage graph will appear erratic.
Truth be told, a thread pool isn’t merely a container of tasks. A thread pool is a balance between your memory budget, your CPU core(s), and how long your code take to wait around for stuff that’s not the CPU. Get this wrong and you’re likely to choke your hardware with overhead, or starve it of work.
How to Choose the Right Thread Pool Size
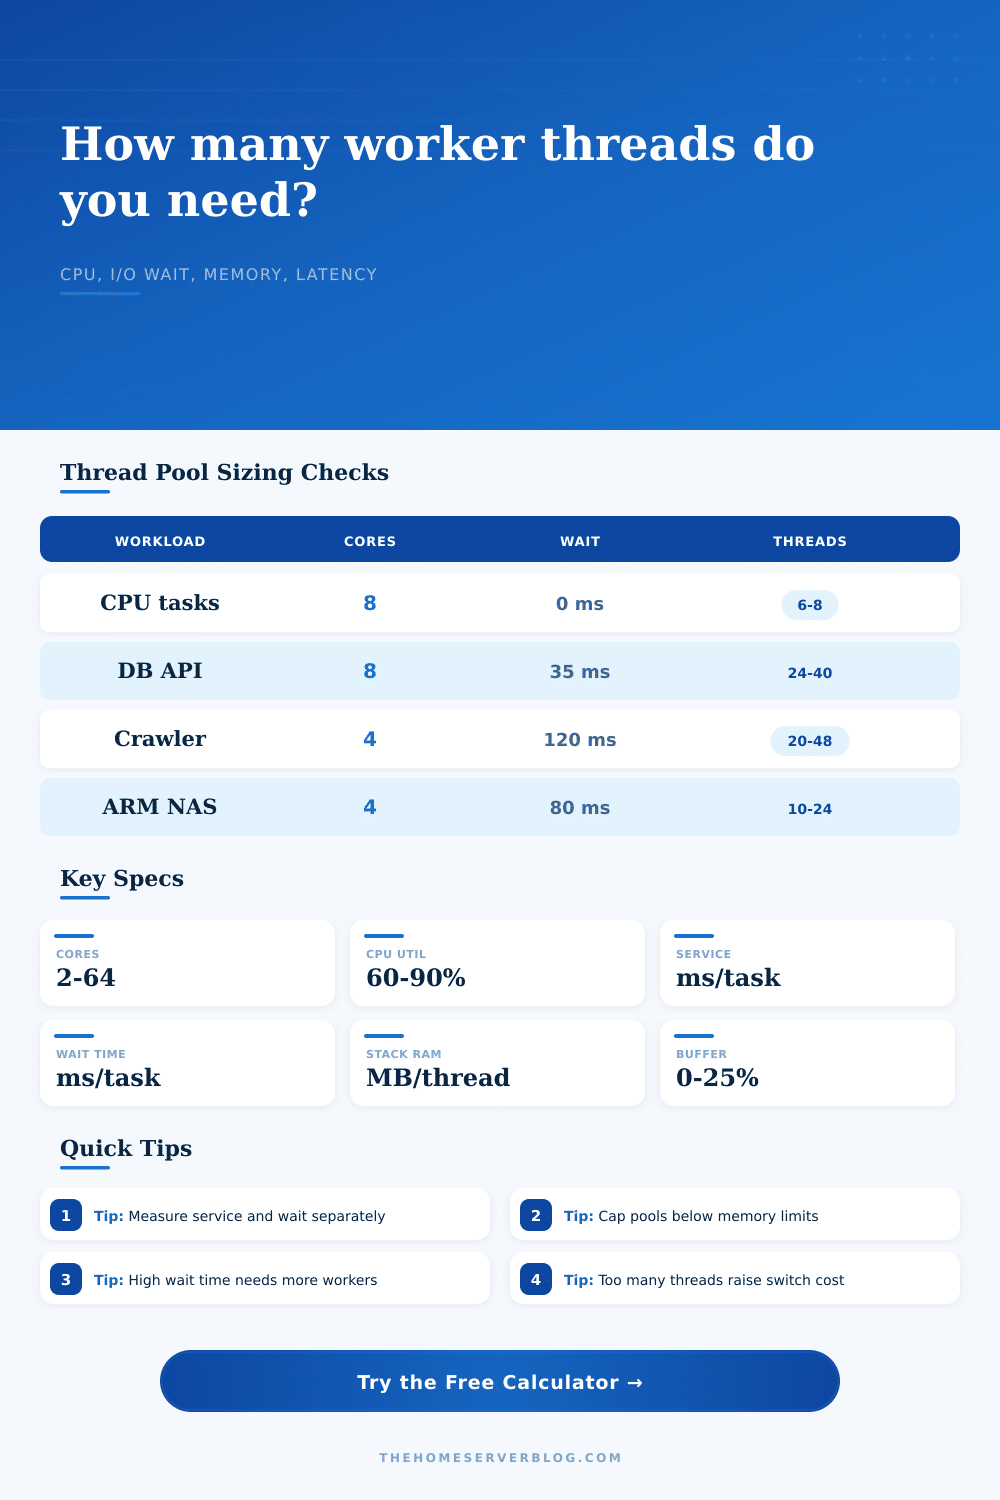
Ultimately what matters most is the wait-to-service ratio; how much time does your code spend executing, versus how much time does it spend parked (waiting on a disk read, network response, or database query)? A thread that’s busy performing some intense computation, encrypting data or reading an image file… Is actualy working. It’s a thread, sure, but we’d prefer as few of them as possible: just enough to fit inside our available core.
On the flip side, if your code spend a lot of its time sending API requests, then those threads will mostly be sleeping. They’ll sit there, patiently awaiting their turn, while the CPU goes off and does something else. There’s no need to worry about having many of these, you might even have far more then you have cores!
Once you input your wait- and service-times, the calculator do all the math for you so you don’t need to guess at which way your workload tilts.
The thing that everyone forgets about till it’s too late: memory is a hard ceiling. NET environments. Spin up two-hundred threads on an eight-gigabyte-RAM server. The system will crash before you even hit a performance bottleneck. It is not about how fast the requests are processed. They’re not getting created at all because there isn’t enough memory allocated by the operating system to spawn those thread. That’s why we have a memory ceiling check built-in here. It converts your stack size plus the remaining RAM into a hard limit on the number of threads you can run. If your calculated optimal size go over this, then you need to lower the pool size even if the throughput formula says otherwise. No amount of CPU power can make up for out-of-memory error.
Context switching have a hidden tax. Each time the CPU kernel switches its focus from one thread to another, it has to save and restore that thread’s state. That costs time, typically measured in microseconds. When you have too many threads, the scheduler will spend so much time switching between threads that it doesn’t get around to executing your code as much. Under load, this can be catastrophic; you’ll see high CPU use but no corresponding increase in throughput. The system is churning away, but it’s doing management work instead of execution work. The context switch estimate in the results will help you visualize the overhead. If the overhead percentage is high, you’re paying a heavy price for concurrency.
A sanity check for your latency targets is Little’s Law: The average number of items in a system is equal to the arrival rate times the average time spent in the system. In other words, if you have a latency budget of two hundred milliseconds and one-hundred requests to handle per second, there is an implied amount of simultaneous task necessary to sustain those numbers. If your thread pool can’t handle that concurrency, it will fall behind, leading to growth on your queue and ultimately breaching your latency budget. It’s a straight-forward arithmetic constraint that tells you the smallest possible pool size needed to achieve your response time goals.
And lastly, consider this an entry point, not the definitive answer. There are few steady state conditions in real world workloads. Network jitter, bursts of traffic, and database locks will stress it. You can’t plan for them in the formula.
Configure your pool to this size. Then look at the garbage collection pauses and run queue length. Tune accordingly; adjust based off what you see happen, not to some idealised perfection. You want a system that’s still responsive when under load. Not a system optimized for maximum throughput at any cost.