Load Test Concurrency Calculator
Estimate virtual users, active in-flight requests, generator count, network volume, and ramp pressure for API, browser, WebSocket, gRPC, and mixed home lab load tests.
▣Real load test presets
⚙Load model inputs
Full calculation breakdown
Generator health check
🖥Equipment and protocol comparison grid
Good density for REST, JSON, health checks, and cacheable service endpoints.
Browser tests spend more CPU and RAM per VU because rendering and JavaScript run locally.
Efficient binary framing can raise VU density when streams are simple and CPU is available.
Long-lived sockets need file descriptors, heartbeats, and memory even when message RPS is low.
Simple cached GET traffic often supports more workers per generator node.
TLS handshakes, cookies, CSRF tokens, and redirects reduce generator density.
Payload variance and client-side parsing make query mixes less uniform than simple REST.
Use for realistic paths with assets, API calls, waits, uploads, and session state.
📊Reference tables
Core formulas for load test concurrency
| Result | Formula | Use | Watch |
|---|---|---|---|
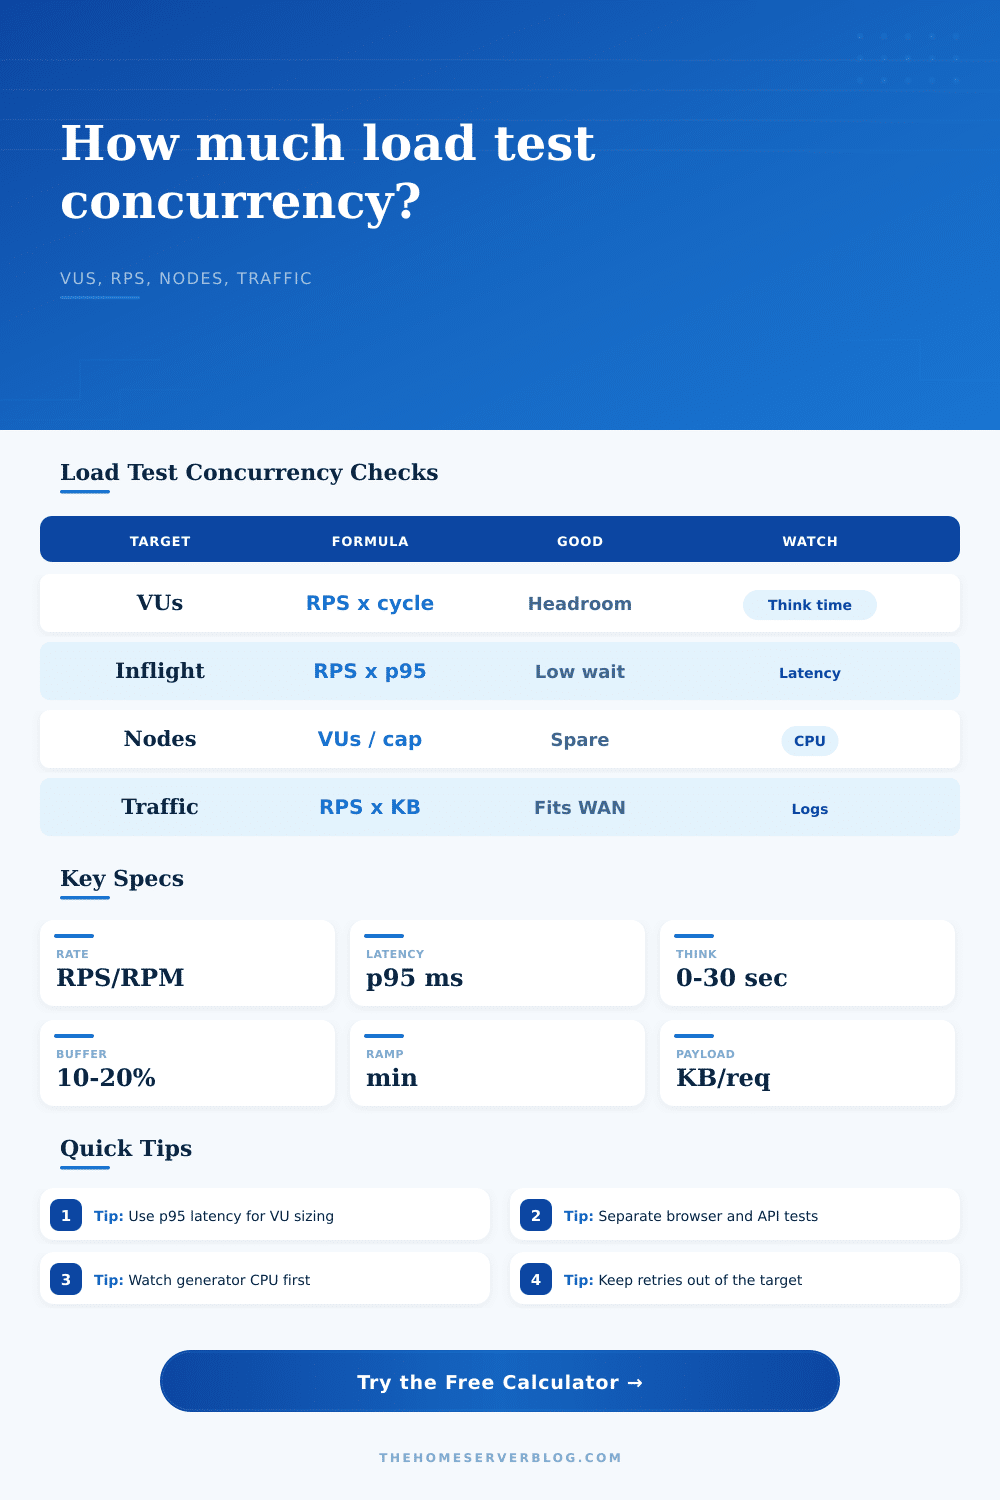
| In-flight requests | RPS × response seconds | Active request pressure on the service | Use p95 or p99, not only average latency. |
| Virtual users | RPS × (response + think) | Closed-loop or session-style generators | Long think time can require many idle VUs. |
| Generator nodes | ceil(VUs / effective node cap) | Load generator fleet size | Validate CPU, memory, NIC, and file descriptors. |
| Traffic volume | requests × KB / 1024² | Network and logging estimate | Large payload tests can saturate the generator first. |
| Ramp pace | target RPS / ramp seconds | Arrival acceleration during warmup | Abrupt ramps hide cold cache and queue behavior. |
Load shape capacity factors
| Shape | Peak factor | Average factor | Best use |
|---|---|---|---|
| Steady plateau | 1.00x | 1.00x | Release gate or normal capacity proof. |
| Ramp validation | 1.15x | 0.65x | Find the point where queues or errors start. |
| Short spike | 1.50x | 1.15x | Flash crowd, cache miss burst, or retry storm drill. |
| Long soak | 1.10x | 1.00x | Memory leak, connection leak, and log growth checks. |
| Step capacity | 1.25x | 0.85x | Incremental plateaus for saturation mapping. |
Common home lab load test sizes
| Scenario | Typical target | Concurrency driver | Practical check |
|---|---|---|---|
| WordPress login | 15 to 80 RPS | Redirects, cookies, database writes | Track login errors and PHP worker queues. |
| Home Assistant API | 30 to 250 RPS | Device polling and automations | Separate API latency from event bus delays. |
| Grafana dashboard | 20 to 150 RPS | Panel fanout and database queries | Watch datasource pool waits. |
| Static cache edge | 300 to 3000 RPS | Network and TLS more than app CPU | Measure generator NIC and kernel limits. |
| Browser journey | 5 to 60 VU starts/min | Browser CPU and page script weight | Use fewer users per node than API tests. |
Generator planning checklist
| Resource | Rule of thumb | Why it matters | Before trusting result |
|---|---|---|---|
| CPU | <70% per node | Generator CPU skews latency when saturated. | Record CPU during a dry run against a stub. |
| Memory | Leave 20% spare | Session state and browser contexts grow over time. | Check resident memory after the full duration. |
| Network | <75% NIC rate | Payload-heavy tests bottleneck on egress or ingress. | Compare measured Mbps with the calculator volume. |
| Connections | Raise fd limits | WebSocket and TLS tests can hit file descriptor caps. | Check ephemeral ports and TIME_WAIT behavior. |
| Clock sync | NTP enabled | Distributed percentiles need aligned timestamps. | Verify all generator nodes before a report run. |
💡Practical load test tips
On that day you run a test and expect fifty users but the server melts down at thirty. You are confused by the metrics staring back at you, after all, fifty seemed safe on paper. How could this happen?
It happens more often then you’d think. And it’s typically a mismatch between what you planned for vs. What happened once the traffic hit the wire.
How to Plan Your Load Test Correctly
Throwing as many requests per second isn’t the only measure of concurrency. It’s also about how many of them live simultanousy and how long they stay alive. After plugging in your latency and target rate, the calculator (above) does the math for you. You don’t need to guess the conversion factor or coefficients which often trip people up.
Little’s Law forms the core engine here. It’s a rule of thumb for queues. It sounds academic but it is as simple as that. If your requests takes half a second to process and you can only serve one per second then you’ll need two virtual users to keep the pipe full. One packs next bag, and the other waits on server.
Latency spikes make this trickier than simple arithmetic. That’s what most engineer miss. They plan based off their average response time. The average is a comfort number it hides the tail. Plan for the ninetieth percentile. That’s where the real load lies.
The second invisible factor behind concurrency is think time. When you run a test in a browser, users read a page and then they click and then they pause and then they click again slowly. Each virtual user is sitting idle for minutes at a time between periods of active use. Too aggressive a simulation of this pause will result in exploding numbers of virtual users as your users just wait around doing nothing. Your load generators starts to pay for idling capacity. You can turn this off/on with the tool so you understand how it impacts things.
If you’re testing an API gateway, you probably want this near zero. If you’re testing a checkout flow, you need to slow down and make them hesitate. Get this wrong, and you’ll either overestimate the number of users required or pay for generators idling away when you didn’t need them.
The place where the rubber meets the road is generator strain. Sure, you may be able to create the perfect concurrency model but if your test machine isn’t able to physically generate the traffic, then it’s all a lie. Based on the type of work load, the calculator will estimate how many nodes you’ll need. If it’s heavy like a headless browser test, it needs to render JavaScript and maintain DOM states. If it’s light like a simple fetch of a static file, you might just need one node for a thousand API calls and ten nodes for a hundred browser users. This is where the page’s reference table comes in. It illustrates which protocols will eat up resources differentaly.
Before you trust the latency results coming back from the server, always take a look at your generator’s CPU usage. If the generator is sweating, the data is suspect.
There’s that pesky retry factor: A well-behaved load tester will attempt the request again when it receives an error from the server; like a 53. This immediately doubles the load. It causes a storm. Unless you take into account this overhead, you can end up with thirty percent more load at your peak than expected. The input of a safety buffer helps here. Ten or twenty percent will provide margin for transient spikes and other error handling that won’t cause the generator fleet to blowup. Better to have extra capacity in tool than for your test to fail midway through because you ran out of file descriptors.
What about ramping? Ramping is also an art form. Don’t go from 0 to full load in a second. That’s shocking the system it will warm up connections too quickly and bypass caches. If you let it gently ramp for five to ten minutes, then it has time to settle into the system. Rather than seeing what it does under the shock of a spike, you see how it behaves under sustained pressure. The calculator will help you see your ramp so you don’t accidentaly run a spike test while thinking you are running a steady plateau.
Concurrency planning isn’t about how many; it’s about what that looks like. It’s an exercise in making a simulation of your reality. Reality is not pretty. There are spikes, there are pauses, and there are errors. Your test should of been too.
Run a dry run, see if the generators can handle the load. Estimate the bounds using the tool, but trust the generators when they are healthy. Scale out if not. It’s a little thing, but it counts. Don’t try to hit a number. Try to get the right number. Have confidence that you got it. Do the math first, then listen to the hardware for the truth.