Data Center PUE Calculator
Estimate power usage effectiveness from metered facility load or a modeled support-load stack, including UPS loss, distribution loss, cooling energy, fans, pumps, lighting, humidification, and growth margin.
PUE Breakdown
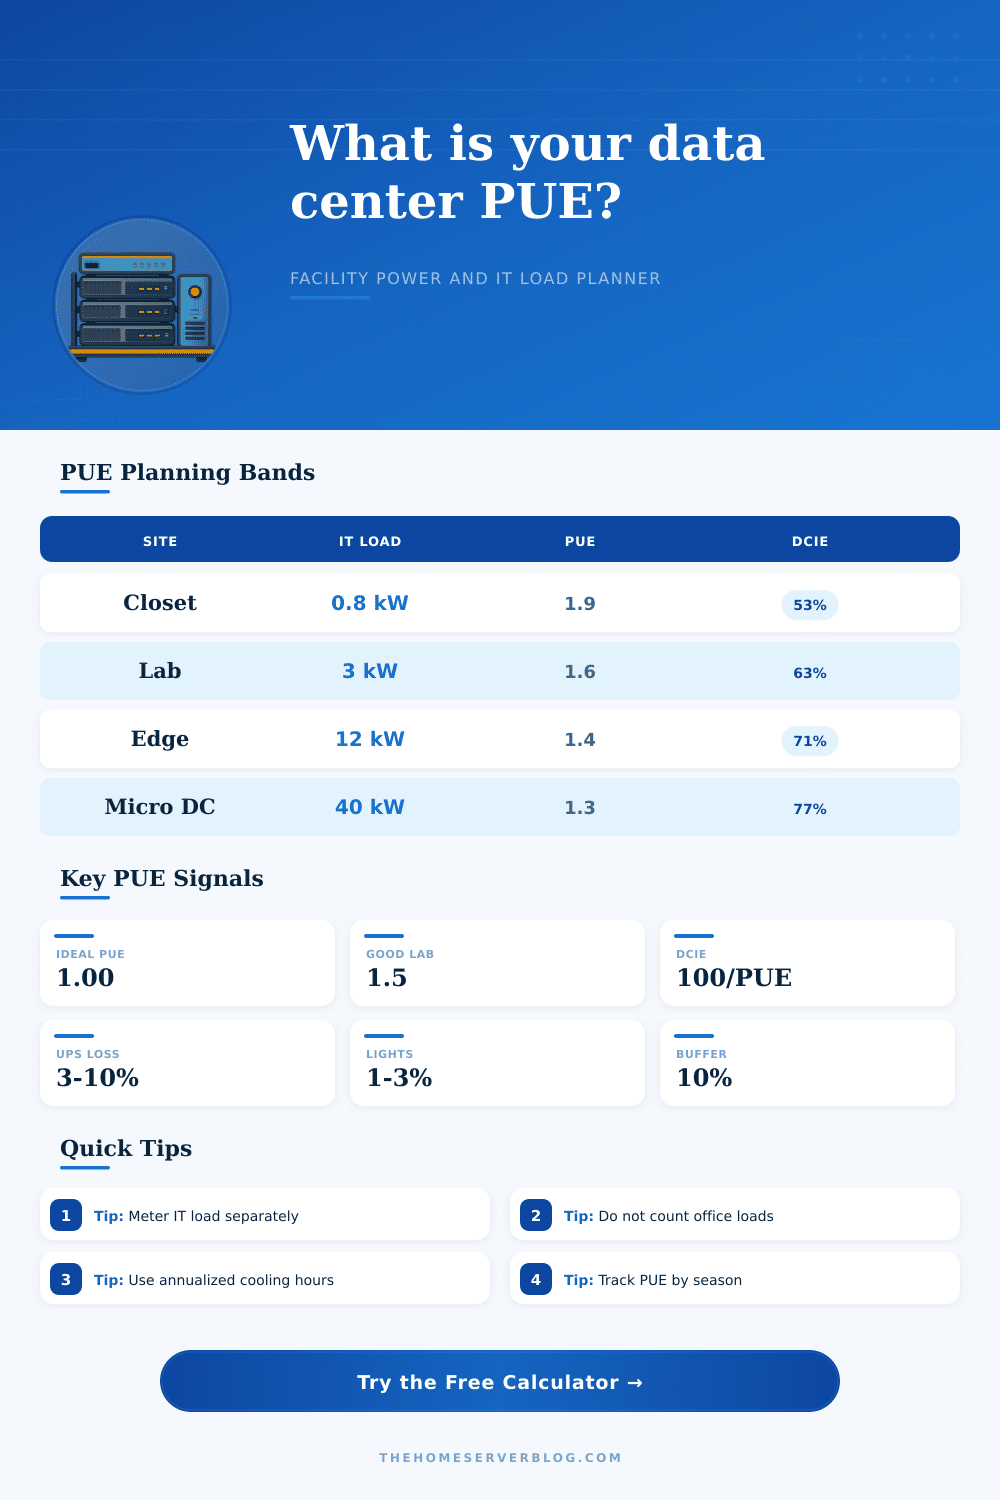
| PUE band | DCiE equivalent | Typical situation | Planning interpretation |
|---|---|---|---|
| 1.10 to 1.30 | 91% to 77% | Highly optimized dedicated data center | Usually requires excellent airflow, efficient cooling, and strong metering discipline. |
| 1.31 to 1.60 | 76% to 63% | Efficient small data room or modern edge site | Good target for a controlled micro data center or well-run home lab room. |
| 1.61 to 2.00 | 62% to 50% | Mixed building HVAC or small server room | Common when cooling is shared, metering is rough, or airflow paths are imperfect. |
| Above 2.00 | Below 50% | Legacy room, portable cooling, or boundary issue | Check whether office loads are included and inspect cooling fan energy first. |
| Load category | Include in IT energy? | Include in facility energy? | Boundary note |
|---|---|---|---|
| Servers, storage, and switches | Yes | Yes | Meter at PDU output or IT branch circuits when possible. |
| UPS losses and transformers | No | Yes | These are infrastructure losses even though they support IT load. |
| CRAC, mini-split, fans, and pumps | No | Yes | Cooling energy is normally the largest non-IT component. |
| Office lighting and workstation loads | No | No | Exclude unrelated building loads outside the data center boundary. |
| Cooling profile | Modeled cooling ratio | Fan or pump ratio | Best fit |
|---|---|---|---|
| Portable AC or spot cooler | 0.55 to 0.85 kW/kW | 0.08 to 0.16 kW/kW | Temporary closets, not efficient year-round data rooms. |
| Ductless mini-split | 0.20 to 0.38 kW/kW | 0.03 to 0.08 kW/kW | Small 24/7 rooms when low-ambient operation is handled. |
| CRAC or in-row cooling | 0.22 to 0.45 kW/kW | 0.06 to 0.14 kW/kW | Dedicated server rooms with controlled supply and return paths. |
| Economizer-assisted site | 0.10 to 0.25 kW/kW | 0.04 to 0.12 kW/kW | Cooler climates or edge sites with engineered outside-air operation. |
| Project scale | Common IT load | Expected PUE range | First thing to verify |
|---|---|---|---|
| NAS closet with network gear | 0.3 to 1.0 kW | 1.7 to 2.5 | Whether whole-room HVAC energy is being assigned fairly. |
| Single home lab rack | 1.5 to 6.0 kW | 1.4 to 2.0 | Separate IT metering and a real return-air path. |
| Office MDF or IDF room | 2.0 to 12.0 kW | 1.5 to 2.2 | Shared building HVAC fan energy and after-hours cooling. |
| Two-rack micro data center | 8.0 to 40.0 kW | 1.25 to 1.65 | UPS loading, cooling modulation, and containment leakage. |
This calculator is a planning and audit aid for home labs, edge rooms, and small data centers. Final efficiency reporting should use documented metering boundaries, consistent intervals, and the same IT-load definition every time.
Power usage effectiveness, or PUE, is a metric for data centers that measure how much energy the data center overall use compared to how much energy the IT equipment in the data center use. The higher the PUE, the less energy efficient the data center. Since each watt of energy that a data center uses that is not for IT purposes is one less watt that can be used for IT purposes, it is important that facilities track their PUE.
A PUE of 1.8 indicate that a data center is using almost as much energy to cool the data center and power clean the data center as it is to power its IT equipment. Data centers with high PUE values has higher electric bills and create more carbon dioxide than those with low PUE values. Data centers often begin to measure their PUE due to two main reason: power costs are increasing at the facility, and the vendor that owns the data center ask for a measurement of the efficiency of that data center.
What PUE means and how to lower it
While data center operators can calculate PUE, there is mistakes that people often make. The calculator included in this tool will make that calculation for the data center operator, thus eliminating the need to use separate spreadsheets to calculate energy values for power, cooling, and lighting. There are two groups of values that should be entered into the calculator.
The first group of values relates to the IT equipment; this information include the nameplate power of the servers, the average utilization rate of the data center, and the number of operating hours that the data center experiences each year. The second group of values relates to the power that is required to maintain the IT data center and servers; these values include the power loss that occurs with UPS systems, power loss due to distribution transformers, power for mechanical cooling systems, fans, lighting, and any other auxiliary system in the data center. Any changes to these values will impact the calculated PUE.
For instance, if a data center employs mini-split cooling systems rather than portable cooling spots, it will use 0.28 kW of cooling power for every 1 kilowatt of IT power; if it uses portable cooling spots, it will use 0.56 kW of cooling power for every 1 kilowatt of IT power. The season in which the data center is measured impacts PUE calculations because weather can increase or decrease the power requirements for cooling. Data centers that take advantage of cool air during the nighttime can reduce their requirement for mechanical cooling systems.
These percentages of the year that the data center can take advantage of cool outside air can be entered into the calculation to reflect the weather impacts upon the PUE. Another of the main impacts upon the PUE calculation is the boundary of what is included within the power usage of the data center. Offices, lighting, and air handlers that is not part of the IT data center should be excluded.
If office lighting and air handlers are included in the power calculations, the total power will be increased; redundant cooling systems that are only used for maintenance should be excluded; if those systems are included in the power calculation, the power will be understated. Another factor that can increase the PUE are redundancy settings for power and cooling systems. Data centers that use 2N redundancy modes will have an increased use of transformers, UPS systems, and chillers.
These systems will still use some of that power even when the IT systems are not using that power; the redundancy of those systems will have an increased power impact on the PUE. Once the power usage effectiveness has been calculated, there are two different values provided. The PUE value indicates the efficiency of the data center.
The DCiE percentage indicate the percentage of power that reaches the IT equipment. The calculator can determine the DCiE percentage by dividing 100 by the PUE value. For instance, if a data center has a PUE of 1.4, it will have a DCiE value of 71% because 100 divided by 1.4 is approximately 71; thus, 29% of the power at the data center is not reaching any of the IT devices.
These two values can be used in comparisons of data centers of any size, or data centers can be explained to others in terms of percentages. The tables included beside the PUE calculations provide information on the typical PUE value of different types of data centers. Data centers that contain only IT equipment and that are well-run have a PUE between 1.25 and 1.65.
Data centers that include IT equipment and other areas of the facility have a PUE between 1.6 and 2.2. Data centers that employ legacy cooling systems have a PUE value that typically exceeds 2.0. When measuring the PUE of small data centers, there are some mistakes that many people make.
One of the most common is using the nameplate power readings of the IT equipment instead of the power that is actualy used by that equipment. Since IT data center servers do not use their maximum power at the same time each day, using the nameplate power will result in an underestimation of the power that is used by the IT equipment and, thus, an overstatement of the PUE value. Another mistake is only measuring the power values of the data center during the summer months when the data center is cooling the data center the most; if these power values are used to calculate the PUE, the PUE will be overstated.
Yet another mistake is in mixing the values of the data center power meters with the modeled power of support systems; if the buffer value is adjusted to meter the power values of the data center, the power calculations will not be comparable. The main way to improve the PUE of a data center is to focus on the power values related to cooling the data center; cooling makes up the largest percentage of support power for small data centers. Increasing the supply air temperature, sealing the data center, and using variable-speed fans will reduce the requirement for mechanical cooling.
Another way to improve the PUE is to reduce the power loss of UPS systems by adjusting the size of those systems. Reducing the lighting of the data center will also save some of that power. Each of these changes can be entered into the calculator to view the impact that each will have on the power and PUE of the data center.
As a management tool for data centers, the PUE can help data center operators to monitor the efficiency of the data center. For instance, if the PUE increases over the quarters, an operator can determine that the efficiency of the data center is decreasing due to various issues. Furthermore, the data that is collected from data centers with calculated PUE values can help planners to determine how many watts of power will be required to support each new server that is added to an IT data center.
The value of measuring the PUE is that if the PUE can be lowered, the data center will have lower operating costs. This benefit applies regardless of the size of the data center. While the calculation of PUE is relatively simple, the management of data centers that understand each of the factors that impact PUE can use this tool to monitor and improve the PUE of that facility each quarter.