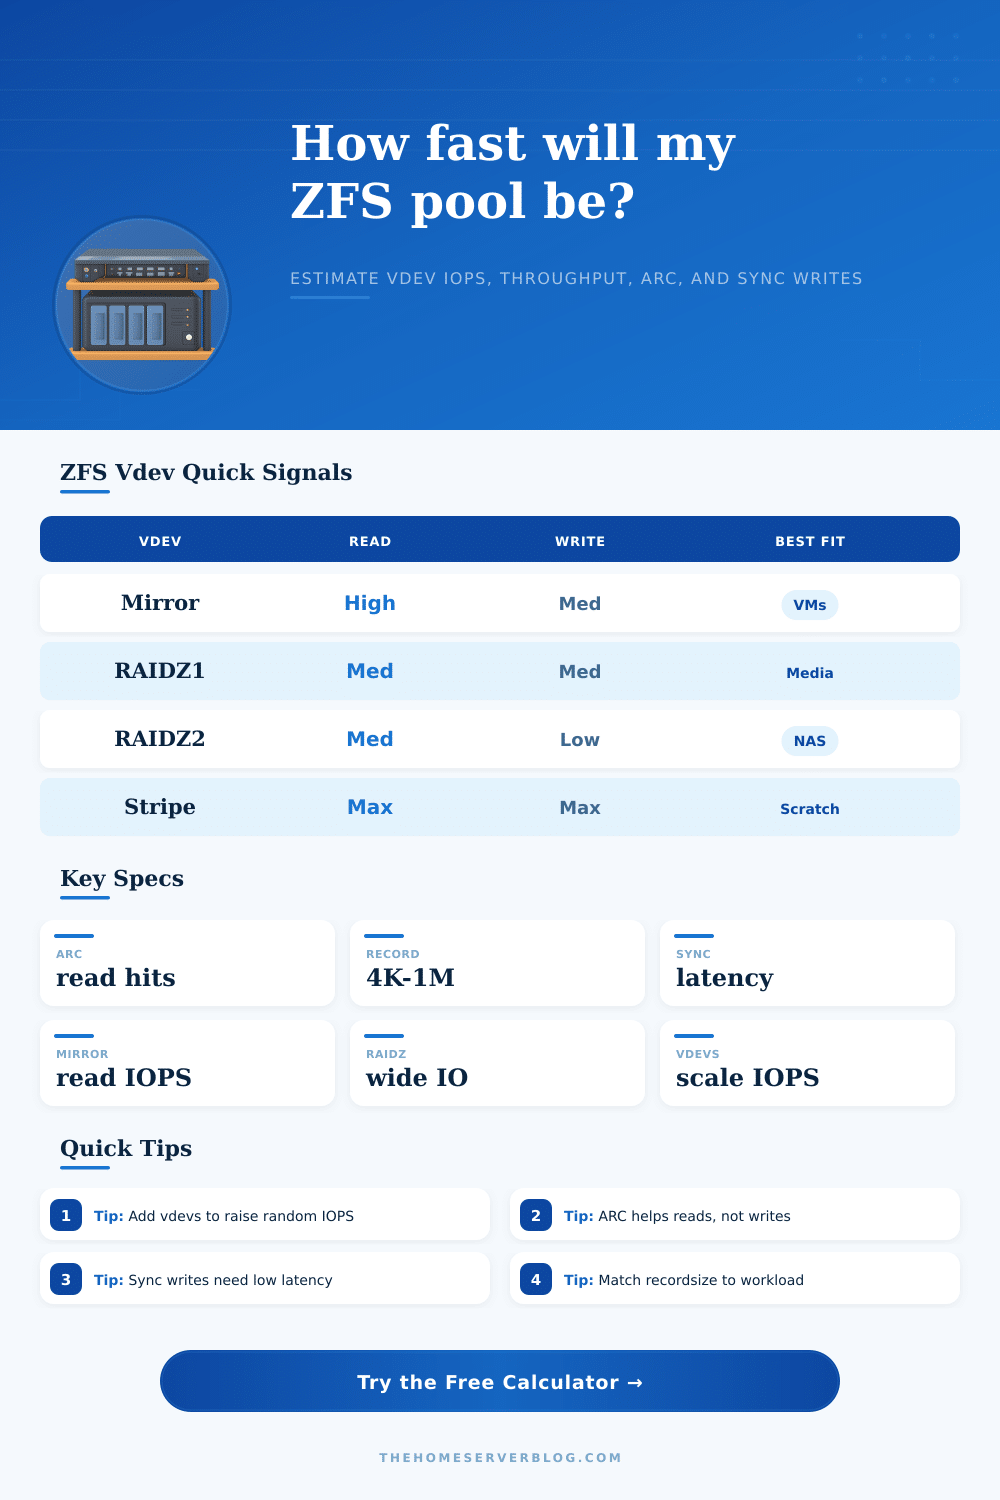
ZFS RAID Performance Calculator
Estimate ZFS pool performance from vdev layout, disk class, recordsize, read/write mix, ARC hit ratio, and sync write behavior.
Choose a named home lab pool, then tune disk count, recordsize, cache hit ratio, and sync behavior to match your workload.
These rules describe broad ZFS behavior. Exact results still depend on controller queues, ashift, dataset properties, fragmentation, workload locality, and latency targets.
| Vdev Type | Read IOPS Shape | Write IOPS Shape | Throughput Shape | Common Use |
|---|---|---|---|---|
| Single disk stripe | Scales with each disk | Scales with each disk | Highest simple scaling | Scratch data only |
| Mirror vdev | Reads can use mirror members | Writes behave like one disk per mirror | Good reads, steady writes | VMs, databases, apps |
| RAIDZ1 | Good for larger records | Small writes are vdev-limited | Strong large-file throughput | Media and light NAS |
| RAIDZ2 | Similar to RAIDZ1 with more parity | Lower small-write headroom | Reliable large-file storage | General home NAS |
| RAIDZ3 | Good sequential reads | Heavier parity overhead | Best on wider archival vdevs | Backup and archive pools |
| Disk Profile | Read IOPS | Write IOPS | Read MB/s | Write MB/s |
|---|---|---|---|---|
| 5,400 RPM quiet HDD | 120 | 110 | 170 | 150 |
| 7,200 RPM NAS HDD | 180 | 160 | 240 | 220 |
| SATA SSD | 75000 | 55000 | 540 | 500 |
| NAS endurance SATA SSD | 90000 | 70000 | 560 | 520 |
| PCIe 3.0 NVMe SSD | 350000 | 260000 | 3200 | 2600 |
| PCIe 4.0 NVMe SSD | 650000 | 500000 | 7000 | 5200 |
| Recordsize | Typical Workload | IOPS Bias | Throughput Bias | ZFS Note |
|---|---|---|---|---|
| 4-8 KiB | Databases | High random ops | Lower sequential efficiency | Needs low latency storage |
| 16-32 KiB | VM disks | Good mixed IO | Moderate throughput | Often paired with mirrors |
| 64-128 KiB | Shares and apps | Balanced | Good default behavior | Common general setting |
| 256 KiB-1 MiB | Media and backups | Lower small IO focus | Better large streams | Often fits RAIDZ pools |
| ARC / Sync Setting | Performance Effect | Best Used For | Caution |
|---|---|---|---|
| High ARC hit ratio | Raises effective read IOPS | Repeated reads, metadata, hot files | Does not make writes faster |
| Mostly async writes | Best write aggregation | Media, backups, noncritical shares | App must tolerate normal async semantics |
| Standard sync mix | Moderate write latency | NFS, SMB, light VM workloads | Depends on workload and client flags |
| Sync always with SLOG | Latency-focused safe writes | Databases, VM stores, NFS datastores | SLOG must have power-loss protection |
| Home Lab Pool | Layout | Strength | Tradeoff |
|---|---|---|---|
| VM datastore | Striped mirrors | Random IO and resilver speed | Lower usable capacity |
| Media NAS | RAIDZ1 or RAIDZ2 | Capacity and streaming reads | Lower random write IOPS |
| Backup target | RAIDZ2 or RAIDZ3 | Redundancy and large writes | Not ideal for busy VM disks |
| Scratch pool | Stripe | Maximum speed | No disk redundancy |
ZFS performance are based on the difference between the ability of the individual disk in the pool and the performance that the ZFS pool delivers. There are a variety of factor that contribute to the difference between those two values, including redundancy, caching, and the way that the workloads is defined upon the pool. While many people calculate the performance of their proposed ZFS array as a function of the number of disks and the total amount of capacity that the disks will provide, many people is surprised at the performance of random IOPS or the latency of writes.
The calculator allow a user to define their individual disks, their vdev layout, their recordsize, and their cache configuration, and then calculate the performance of the pool that would result from those settings. One of the most common mistake that individuals that are formulating their ZFS array make is to assume that adding more disks to a single vdev will provide more performance to that ZFS pool. While adding a disk to a RAIDZ array will increase the sequential throughput of that array, as well as the amount of redundancy provided to that array, the write IOPS for the array will still be limited by the slowest individual disk within that array.
ZFS Performance and Capacity Calculator
Adding another vdev to an array, however, will multiply the number of independent IOPS that can be provided to that ZFS pool. The calculator can separate those two values, allowing for the determination of whether the constraint to a ZFS pool is its capacity or its random IOPS performance. Another of the main factor that contributes to the performance of a ZFS pool is the recordsize that the pool utilizes.
Small record sizes is beneficial for databases or virtual machine images, as they can efficiently perform the random IOPS that are required by those systems of data. Small record sizes, however, will result in each disk within the pool having to move less data during each operation. Large record sizes will allow for faster data transfer for media libraries and data backups, but will make any small write to that ZFS pool more costly.
The tool can help evaluate the impact that different record sizes will have upon performance of the disks that the ZFS pool is to be utilized by. The hit ratio of the ARC cache can also impact the performance of a ZFS pool. If the data that the systems that are utilizing that ZFS pool access can be entirely contained within the memory of the system, then the disks within the pool will only ever have to process the IOPS that are generated by the system as misses of the ARC cache.
The calculator can factor in this hit ratio, and display to the user the performance that the systems that utilize the pool can be expected to experience. It is important, however, to remember that the ARC cache only benefits read operations; writes will still have to travel through the vdevs that make up the pool, and any SLOG that is defined for that ZFS pool. Another of the factor that can impact the performance of a ZFS pool is the sync write behavior of the pool.
For most systems, the default sync write behavior is acceptable. For systems that write large amounts of data, such as databases or virtual machine datastores, however, the latency of writes is a concern. In this case, you can employ an SLOG device that can accept all synchronous writes from the ZFS pool, and allow those writes to be flushed at a later time.
This factor can be defined within the calculator for arrays with an SLOG, and prevents the discovery of a new NVMe ZFS pool that is slow to accept synchronous writes. Capacity planning can be performed alongside performance planning for the ZFS pool. The usable capacity of a ZFS pool is defined by its parity overhead, the amount of space that is required for snapshots, and the compression ratio of the data that will reside within the pool.
The model depicts both the protected physical capacity of the disks after the space that is required for snapshots, as well as the logical capacity that will be available after the data is compressed. This overview can assist in the decision as to whether additional disks should be purchased, or whether another vdev can be added to an existing ZFS pool. ZFS pools will change over time.
As data is written to and snapshots are taken of those pools, as well as as the scrubbing process runs for those pools, the headroom that was calculated for that pool will decrease. While the calculator does not model the effects of fragmentation or snapshot accumulation over time, the calculator does provide a starting point for the planning of a ZFS pool. While many create the ZFS pool and then never re-access the calculator, it is always beneficial to review the calculator after some time has passed and the pool has grown; it may be that another vdev should be added to the pool, or that another type of disk should be purchased for the ZFS arrays.
In formulating a ZFS pool, it is beneficial to test two or three different layouts for the pool against the same workload that will utilize the data within the pool. Changing the disk type, the vdev width, and the recordsize can all be easily accomplish within the calculator, and allow for the determination of which variable has the greatest impact upon the performance requirements for the ZFS pool. Thus, before any hardware is purchased for a data center, this exercise can ensure that the ZFS pool that is created will neither be underpowered, nor unnecessarily expensive to operate.