Recovery Time Objective Calculator
Estimate actual restore time from service priority, runbook steps, data restore rate, validation, DNS or app warmup, and staffing parallelism.
Target vs Actual RTO
| Service priority | Typical target | Restore posture | Planning note |
|---|---|---|---|
| Critical | 15 to 60 minutes | Hot standby or fast snapshot | Pre-stage secrets, DNS, monitoring, and network paths. |
| High | 1 to 4 hours | Tested VM/container restore | Automate config, check backup health, and rehearse owner signoff. |
| Standard | 4 to 12 hours | Documented restore from backup | Manual steps can work if credentials and media are verified. |
| Low | 24 hours or more | Best-effort rebuild | Prioritize data integrity and dependency order over speed. |
| Restore method | Base runbook | Parallel fit | Common bottleneck |
|---|---|---|---|
| Snapshot rollback | 20 to 45 minutes | Low | Storage snapshot age and application consistency. |
| VM/container restore | 60 to 120 minutes | Medium | Image transfer speed, secrets, and network mapping. |
| Bare metal rebuild | 150 to 270 minutes | Medium | Firmware, drivers, boot media, and storage layout. |
| Application rebuild | 90 to 210 minutes | High | Package versions, migrations, queues, and app dependencies. |
| Manual runbook restore | 180 to 360 minutes | Variable | Human handoffs and missing tribal knowledge. |
| Backup target | Typical real rate | Best use | RTO caution |
|---|---|---|---|
| USB HDD | 80 to 160 MB/s | Small labs and offline copies | Random IO, encryption, and cable issues can reduce speed. |
| 1 GbE NAS | 70 to 110 MB/s | Home servers and office shares | Network ceiling limits large restores unless staged earlier. |
| 10 GbE NAS | 300 to 900 MB/s | VM farms and media libraries | Disk arrays, snapshots, and dedupe can still bottleneck. |
| Cloud object | 40 to 250 MB/s | Off-site DR and regional failure | Egress path, restore tier, and API throttling matter. |
| Project size | Data restored | Likely actual RTO | Staffing suggestion |
|---|---|---|---|
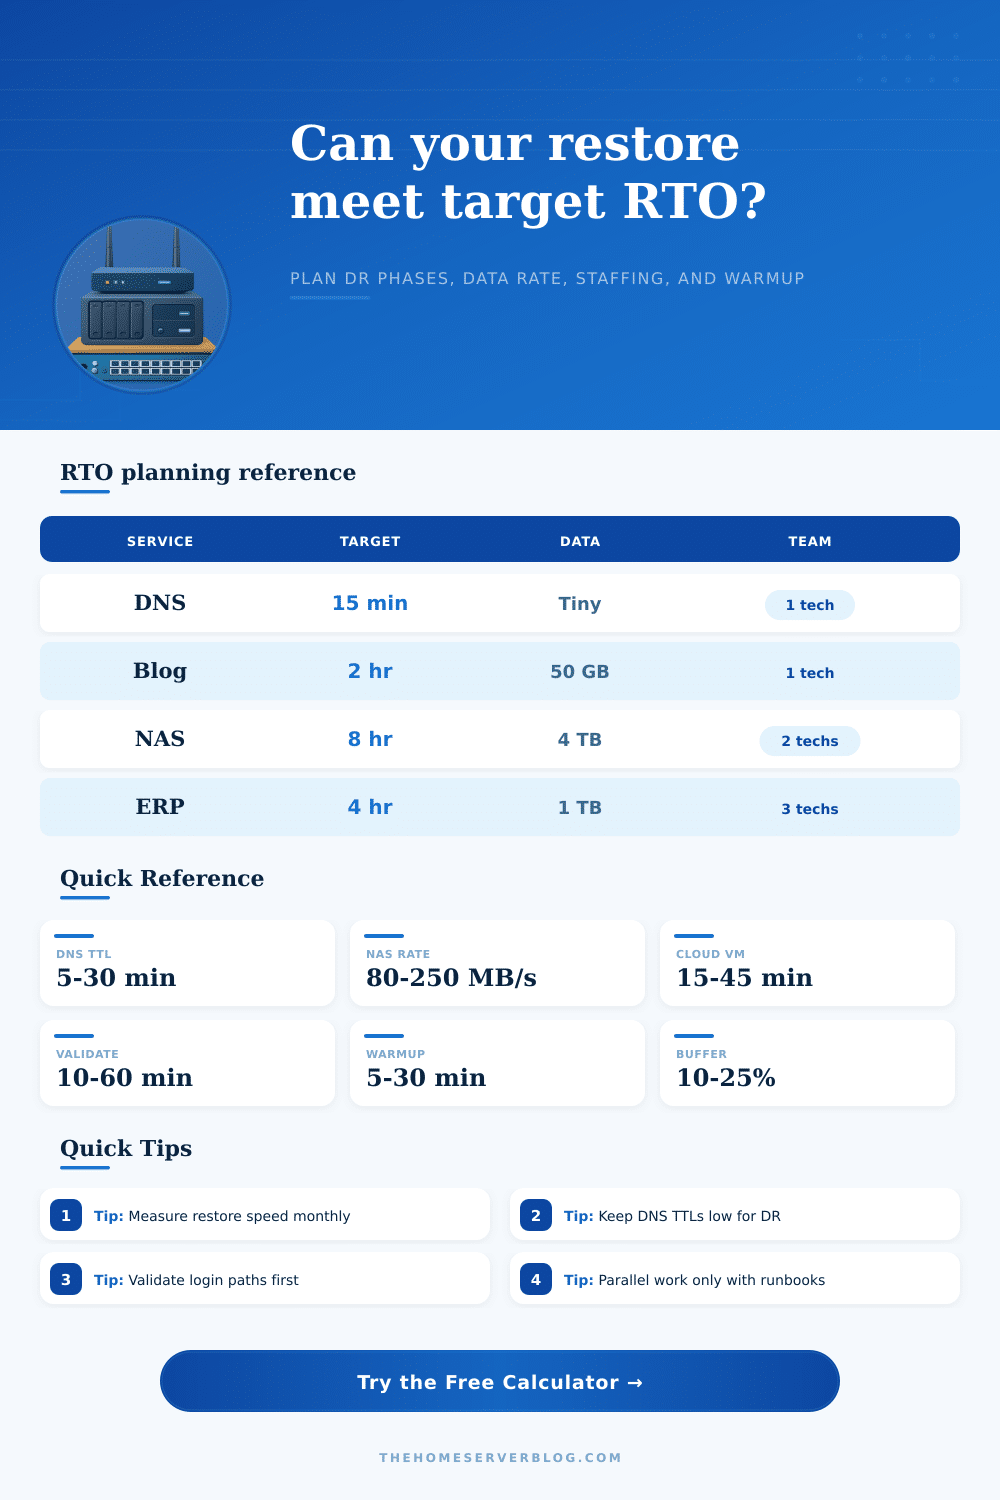
| Home DNS or reverse proxy | Under 5 GB | 15 to 45 minutes | One person with documented DNS registrar access. |
| Personal blog or small VPS | 10 to 80 GB | 1 to 3 hours | One operator plus prebuilt infrastructure scripts. |
| Nextcloud or family NAS | 500 GB to 4 TB | 5 to 18 hours | Two people if app validation and storage work overlap. |
| Small business application | 200 GB to 1.5 TB | 2 to 8 hours | Assign app, infrastructure, and validation owners. |
It’s tempting when your 20-minute backup job completes to think you’ve figured out how fast you can recover from an outage. Under pressure, that thinking are dangerous. The fact that you have a backup doesn’t tell you how quickly you’ll locate that backup and restore it onto a working system. It also don’t include testing if applications work or letting your users know that everything is okay.
Planning for recovery time objectives makes you face up to the difference between storing something fast versus getting it back into use. That’s where this page’s calculator comes in: It models all of the restore process (not just the part that moves the data) so that you can see how all that overhead add up.
Why Restoring Data Takes More Time Than Backing It Up
Because it seems like administrative busywork when it isn’t needed… until it is. Then you realize you have to report the incident and set up a target environment. You then have to move the data, configure the applications, check the service, and warm up DNS or application caches. Each step take real clock time.
And if you’re not doing any of these things in parallel (which is likely), then the sum of them all will double… Or triple!, what you think the time might be based off solely on moving the bits. The whole equation revolves around service priority, because that’s what determines which recovery speed you need to explain.
For critical services, you’ll want them back near-instantly (and typically keep hot standbys or use quick snapshot rollbacks). High-priority items might tolerate a few hours if you have a tested VM restore process. Something like standard service could wait while you rebuilt from tape or your cloud archive. Different levels of priority get different amounts of overhead applied against them, this lets you match your business expectation with your actual technology.
You can’t expect critical performance on a low-priority budget. What you do when things fail is also important. Rebuilding an app stack from scratch on bare metal isn’t the same as restoring a virtual machine. With a snapshot, it might take forty-five minutes to restore; with a manual runbook restore, it could be six hours because someone forgot some tribal knowledge and has to ask another person to get them started.
The calculator includes base time estimates for these procedures, accounting for this difference between snapshots and rebuilds. It won’t let you assume that faster hardware solve slow processes. You can have all the bandwidth in the world, but if you have a runbook that involves three people arguing about configuration files, you’re still going to wait.
Most plans will fail when it comes to staffing. Simply hiring another technician won’t cut your recovery time in half. Without strict separation among tasks, there’s friction from human coordination. Two engineers staring at the same terminal screen? You’re getting nothing.
To model this, the tool lets you enter a parallelism percentage showing how well your runbook divides up responsibilities. Most teams struggles for 30% efficiency in a chaotic situation. Be honest: overestimate this and you’ll create a false sense of security that evaporates in real life outages.
Don’t neglect warmup/propagation time. Even if your app spins up in a flash, that doesn’t mean it’s actually serving customers yet. No matter how quickly DNS propagates, there will always be some delay. Your application cache needs to get filled-in before things go back to normal speed. Your search indexes need to be rebuilt. All those hidden latencies can easily make the difference between hitting an RTO target within five minutes, or falling short by an hour.
The calculator specifically includes these buffers so you can see their collective effect. The table below will give you some benchmarks on what you should of expect based off industry norms. It also calls out where you are likely to have bottlenecks for each type of backup target and restore method.
You may think your one-gigabit network is plenty fast in day-to-day use, but try restoring terabytes over that link. It’s a very serious choke point. Knowing how slow things get at the hardware level allows you to plan if upgrading hardware make sense or if you just need to shrink the size of the data set being restored. Clean configuration and smaller data sets sometimes mean faster restores than trying to recover from faster disks.
Don’t plan for backup completion; plan for the dirty reality of having to restore.