EBS IOPS Calculator
Estimate Amazon EBS volume IOPS, throughput pressure, queue depth, latency fit, and EC2 EBS bandwidth headroom from one workload profile.
⚙Named EBS Performance Presets
💾Workload Inputs
Throughput is calculated as IOPS × IO size / 1024. The final ceiling is the smaller of volume capability, entered throughput cap, and EC2 EBS bandwidth converted to MiB/s.
EBS Performance Result
📊Live Metric Grid
🗂Volume Type Reference
| Type | Performance Shape | Max IOPS | Max Throughput | Latency Notes |
|---|---|---|---|---|
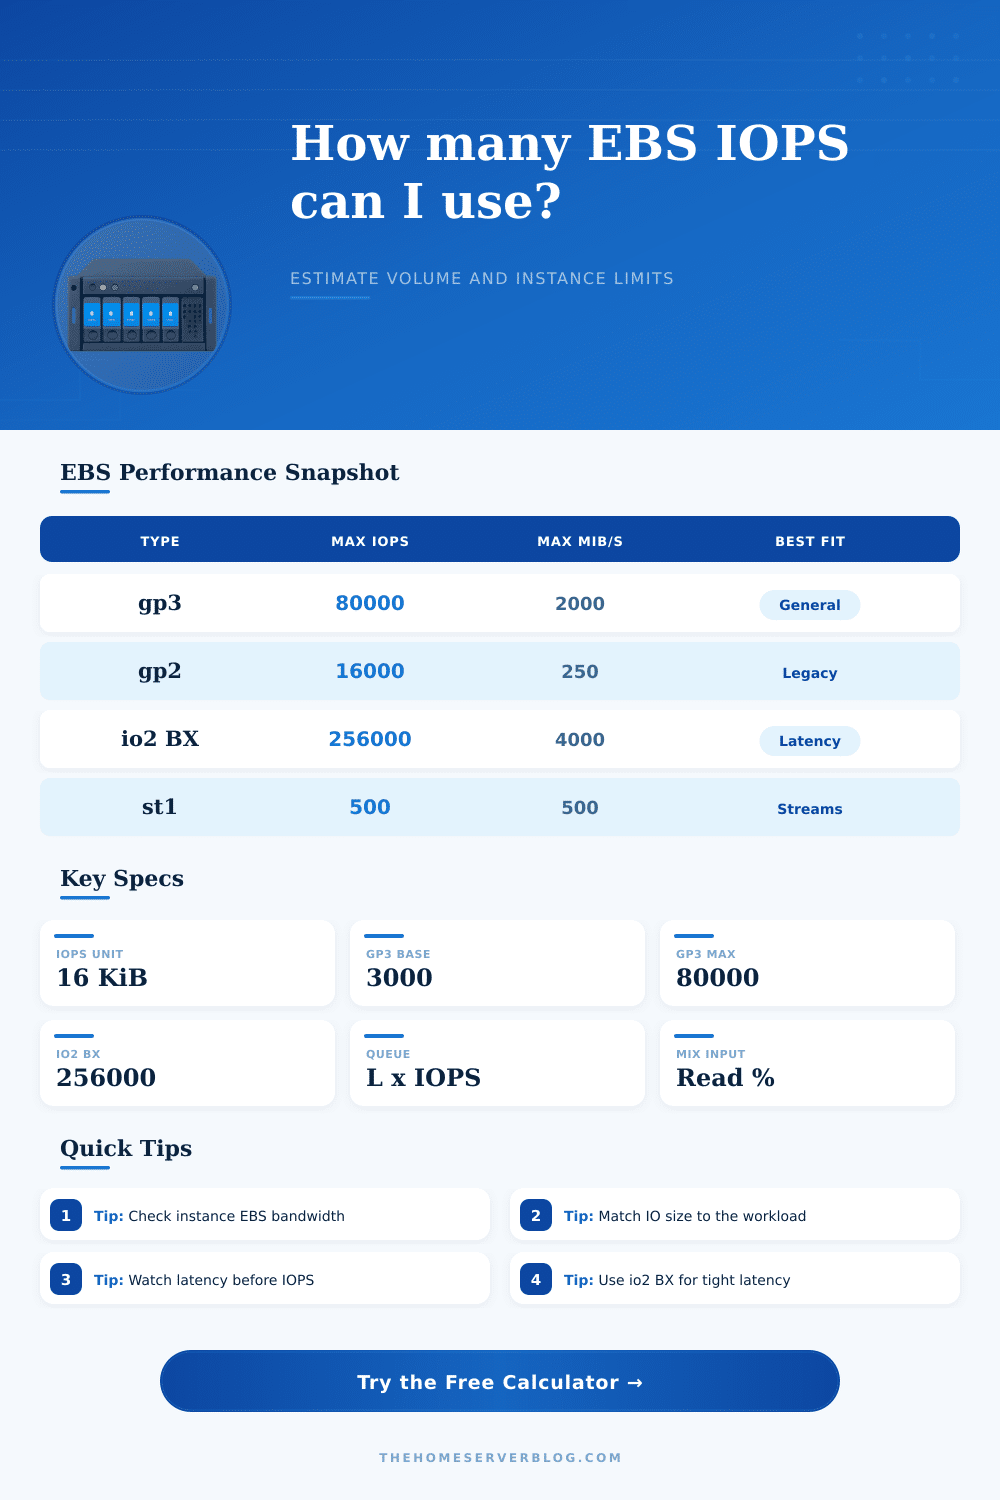
| gp3 | Provision IOPS and throughput independently, baseline 3000 IOPS and 125 MiB/s | 80,000 | 2,000 MiB/s | General purpose single-digit ms class |
| gp2 | IOPS scale with size at 3 IOPS per GiB, with burst behavior below 1 TiB | 16,000 | 250 MiB/s | Older general purpose behavior |
| io1 | Provisioned IOPS SSD for sustained database pressure | 64,000 | 1,000 MiB/s | Designed for consistent provisioned IOPS |
| io2 | Provisioned IOPS SSD with improved durability and consistency | 64,000 | 1,000 MiB/s | Strong fit for critical databases |
| io2 Block Express | High performance provisioned IOPS for Nitro based instances | 256,000 | 4,000 MiB/s | Average under 500 microseconds for 16 KiB IO |
| st1 | Throughput optimized HDD for large sequential streams | 500 | 500 MiB/s | Not for small random IO |
| sc1 | Cold HDD for infrequent sequential access | 250 | 250 MiB/s | Lowest performance class shown here |
📏IO Size and Throughput Reference
| IO Size | IOPS at 125 MiB/s | IOPS at 500 MiB/s | IOPS at 2,000 MiB/s | Typical Signal |
|---|---|---|---|---|
| 4 KiB | 32,000 | 128,000 | 512,000 | Small random database reads |
| 8 KiB | 16,000 | 64,000 | 256,000 | Database page activity |
| 16 KiB | 8,000 | 32,000 | 128,000 | EBS IOPS comparison basis |
| 64 KiB | 2,000 | 8,000 | 32,000 | Search segments or analytics |
| 128 KiB | 1,000 | 4,000 | 16,000 | Large scans and copies |
| 1 MiB | 125 | 500 | 2,000 | HDD stream sizing |
🖧Instance EBS Bandwidth Reference
| Entered Mbps | Approx MiB/s | 16 KiB IOPS Ceiling | 64 KiB IOPS Ceiling | Use When |
|---|---|---|---|---|
| 475 Mbps | 57 MiB/s | 3,648 | 912 | Small burstable instances |
| 3,500 Mbps | 417 MiB/s | 26,688 | 6,672 | Modest database hosts |
| 10,000 Mbps | 1,192 MiB/s | 76,288 | 19,072 | High traffic app nodes |
| 20,000 Mbps | 2,384 MiB/s | 152,576 | 38,144 | Large Nitro instances |
| 40,000 Mbps | 4,768 MiB/s | 305,152 | 76,288 | Block Express class hosts |
🧪Common EBS Workload Sizes
| Scenario | Volume Profile | IO Pattern | Target Range | Watch First |
|---|---|---|---|---|
| Web application root and packages | gp3, 40 to 120 GiB | Small random bursts | 3,000 to 6,000 IOPS | Burst deploy windows |
| PostgreSQL primary data volume | gp3 or io2, 500 GiB plus | Random read heavy | 12,000 to 40,000 IOPS | Latency and checkpoint writes |
| SQL Server OLTP | io2, separate data and log | Mixed random data, sequential log | 30,000 to 80,000 IOPS | Write latency spikes |
| OpenSearch hot tier | gp3 striped data volumes | Search reads and merge writes | 16,000 to 60,000 IOPS | Merge throughput |
| SAP HANA data or log | io2 Block Express set | Very latency sensitive | 80,000 to 160,000 IOPS | EC2 EBS bandwidth |
| Archive ingest stream | st1 or sc1, 1 TiB plus | Large sequential IO | 250 to 500 MiB/s | Throughput, not IOPS |
⚖Comparison Grid
IOPS Limited
Small IO sizes often reach the provisioned IOPS ceiling before they fill the MiB/s pipe. Increase provisioned IOPS, add volumes, or move to io2 Block Express when latency allows no slack.
Throughput Limited
Large IO sizes can consume throughput while the IOPS number looks modest. Raise gp3 throughput, reduce IO size where valid, or stripe volumes for scan heavy tasks.
Instance Limited
The EC2 instance can cap the whole design even when each volume has unused performance. Check EBSByteBalance and EBSIOBalance for sustained pressure.
💡Performance Tips
In storage, it’s not just about how much disk space you purchase. It’s also about how fast data can flow to and from those disks, how big chunks of data need to be sent, and what the limitations on your servers are. A lot of engineers think IOPS is the magic bullet answer for everything. They’re wrong.
In reality there are bandwidth ceilings, queue depths, and throughput limits. They frequentely affect production traffic in ways you wouldn’t expect. These are EBS bandwidth, queue depth, latency targets, and IO size throughput. Remember: One number isn’t everything. Use the calculator as part of the overall picture.
Why IOPS Is Not Enough for Storage
First, remember IO size. It is often overlooked until your database start timing out. By traditional definitions, an IOP is a single 16 KiB operation. That means that an application performing lots of small (4 Ki) random reads will consume your provisioned IOPS budget four-fold relative to a workload reading bigger chunk. Even with a lot of raw throughput available, you may not have enough IOPS capacity. Because the answer depend upon this information, the tool requests your average IO size prior to answering.
Another thing that matters is latency targets. You can have a highly available system, but if it’s not planned out based off the latency target, then it will fail. For example, if you’re doing financial transactions where you want a response time of less than a millisecond, a general purpose volume may be able to handle the IOPS needs. However, under load, it won’t meet them. The calculator also finds out if your queue depth match your latency goal.
In most cases, if you have tight latency targets and high concurrency, you’ll typically need dedicated storage types such as Block Express. Running something like this on cheaper storage is likely to cause timeouts at busy periods.
But don’t forget about the instance itself. I’ve seen people set up a huge volume and then complain that it doesn’t work well. Maybe it’s because of the instance connecting to the volume, it is not the storage layer at all. There is a maximum bandwidth for an EC2 instance connected to an EBS volume. That’s set based off the instance type. After you reach the limit, you can tune the volume all day long and you won’t gain anything. Check out the table on the page for some examples. This isn’t a software issue; it’s a physical limitation of the network interface within your virtual machine. Your volume may be plenty big enough for high-traffic but you’re only attaching it to a small connection on your system.
Stable systems have headroom, a few tenths of a second here, or a gigabyte there is not very expensive; a hard limit reached when your site spikes is incredibly expensive. You can plug that buffer into the calculations ahead of time with this tool so that you avoid right-sizing too tightly for “typical” usage, which is what everyone does: averages conceal maxima, and storage performance is measured in maxima, which must be met without stalling.
When choosing storage volume type, consider how you access your data. Random read and write access (e.g., search index) differs from sequential read/write access (e.g., backup stream, logging). Streaming large files is best done on fast-transfer drives, while small random operations don’t do well. By matching the workload pattern to the hardware you avoid paying for capabilities that you won’t need. You also avoid frustration when you deploy a powerful drive in the wrong context and it performs poorly as a result.
Storage sizing isn’t about the biggest, it’s about knowing your constraints. If you don’t understand what the friction is then how can you eliminate it? Is it the IO size of an app? Is it the network bandwidth? Or maybe the volume limit? Knowing this up front will save you a lot of time down the road. There are tools out there that make these constraints crystal clear. Stop guessing at performance and instead engineer it precisely. When the next big launch arrives your infrastructure wouldn’t of skipped a beat.