Email Bounce Rate Calculator
Estimate deliverability health from sent emails, hard bounces, soft bounces, blocks, retry recovery, list size, invalid addresses, target bounce rate, and campaign volume.
Before retry success reduces soft failures and retryable blocks.
Estimated bad contacts in the full list before the next send.
Policy or reputation failures as a share of sent emails.
Suggested next campaign volume after cleanup and ramp allowance.
Calculate to compare actual and target bounce rate.
Hard bounces drive immediate suppression needs.
Soft bounce recovery protects deliverable contacts.
Volume should scale only after bounce risk is under control.
| Measured Bounce Rate | Deliverability Status | Likely Meaning | Recommended Action |
|---|---|---|---|
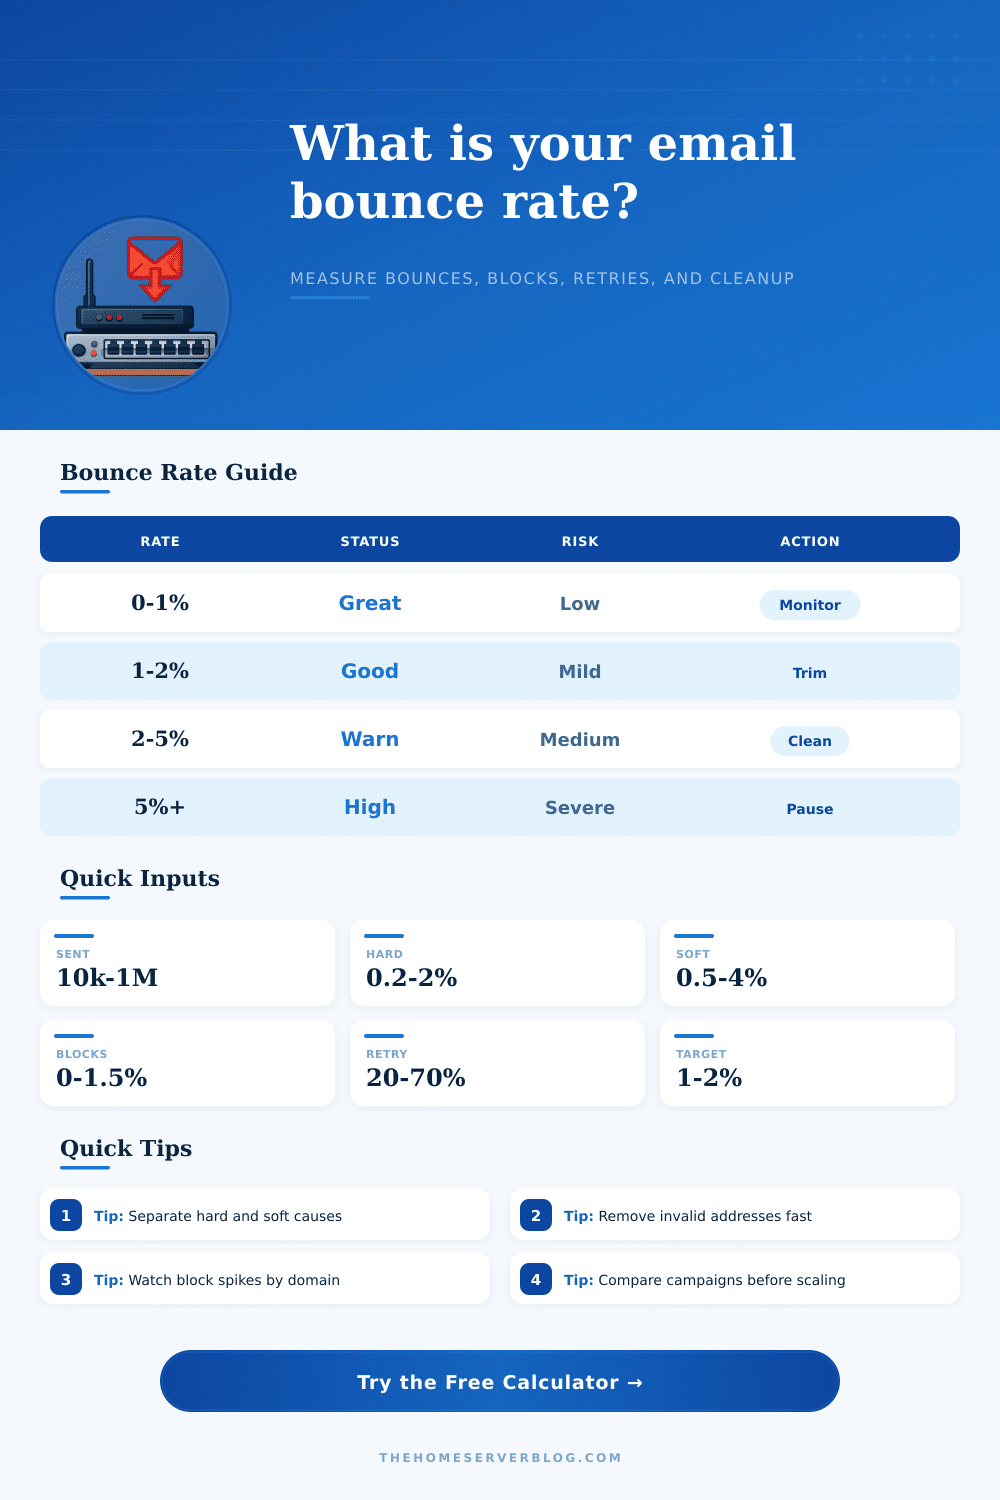
| 0% to 1% | Excellent | List acquisition and suppression are working well. | Keep normal monitoring and remove hard bounces automatically. |
| 1% to 2% | Healthy | Usually acceptable for mixed newsletter and product mail. | Check source segments and trim stale contacts before ramping volume. |
| 2% to 5% | Warning | Stale list, risky import, or domain-level delivery issue may be present. | Pause volume growth, validate high-risk segments, and suppress repeat bounces. |
| 5% to 10% | High risk | Mailbox providers may interpret the send as poor list hygiene. | Reduce volume, isolate the source, and clean before the next campaign. |
| 10%+ | Critical | The list likely contains many invalid or stale addresses. | Stop broad sends, validate the list, and restart with proven engaged segments. |
| Metric | Good Range | Watch Range | High-Risk Signal |
|---|---|---|---|
| Hard bounce rate | Under 0.5% | 0.5% to 1% | Above 1% means immediate list cleanup is needed. |
| Soft bounce rate | Under 1% | 1% to 3% | Above 3% can indicate throttling, old inboxes, or domain problems. |
| Block rate | Under 0.2% | 0.2% to 1% | Above 1% may signal reputation, authentication, or content filtering trouble. |
| Retry success | 50% or higher | 25% to 50% | Under 25% means many temporary failures are becoming practical failures. |
| Invalid address rate | Under 1% | 1% to 3% | Above 3% suggests risky collection, imports, or aging contacts. |
| Preset | Typical List Condition | Expected Bounce Pattern | Planning Note |
|---|---|---|---|
| Weekly Newsletter | Opt-in, recently mailed | Low hard bounces, modest soft bounces | Good baseline for normal list health. |
| Product Launch Blast | Large marketing segment | Volume can expose hidden stale domains | Compare target rate before expanding the blast. |
| Cold Outbound Sequence | Prospecting data | Higher hard bounces and blocks | Validate aggressively before sending. |
| Re-Engagement Winback | Dormant subscribers | Soft bounces and invalid addresses rise | Send in small batches and suppress quickly. |
| Transactional Receipts | Recent active users | Very low bounce expectation | Any spike deserves immediate investigation. |
| Fresh CRM Import | Newly merged records | Unknown hygiene and duplicate risk | Use validation and domain sampling first. |
You send a newsletter to five thousand people and watch the metrics roll in. And the metrics come rolling in. Everything looks good: the open rates are fine, and click-throughs is steady. Then you take a quick peek at the bounce rate and notice it’s at four percent. That doesn’t seem too bad until you consider that for every one email that bounced back from recipient’s inbox, there were another 20 emails that never made it in their inbox in the first place.
No, the issue isn’t that the email didn’t reach there inbox. The issue is that the system recorded a failure, but each provider record these failures differently. Permanent failures (hard bounce) are a dead end. Temporary glitches, known as a soft bounce, include things like a server timeout or a full mailbox.
How to Improve Your Email Deliverability
Why does this matter? There is a difference in how your provider treats these two types of error. While it’ll give you some time to deal with temporary problems (aka “soft” bounces), it will penalize you if you ignore permanent ones (“hard” bounces). Imagine sending a letter to an address where the house was burnt down years earlier. That’s a hard bounce. But what if the mailbox is full or there’s a server timeout? The message would just sit there until they return home. That’s a soft bounce.
With that data about the percentage of hard/soft bounces and the volume you send, all you have to do is plug it into the calculator above and let it crunch the numbers for you. It accounts for the retry recovery: the math here is separating the signal from the noise. Half of your temporary failure may deliver on the next try, so why are you panicking over them? See what your true final bounce number looks like when the dust has settled.
The calculator will let you enter that rate of success. So that’s why most folks don’t see it: they measure health on their immediate error log instead of actual correction in reality. It’s possible to have poor hygiene but hide it with good retry success rates. Monitor that alongside your hard bounce count to see whether your audience is actually shrinking or if there’s just server trouble. So you’ll have a better idea of where you stand as a sender.
There is another issue besides a clear-cut bounce called blocks. These happen when something like an authentication failure or spam filter prevent your message from ever reaching delivery status. Mistaking a block for a soft-bounce underestimates your risk of having a bad rep. The page explains this in the reference table. It shows that any block rate over one percent means your content or domain is being caught by something deeper, like content filtering or domain trust.
That’s why it’s important to report them distinctly, since a sharp increase in blocks typically indicates you have maxed out the sender’s reputation (or hit a trigger for some security rule). That’s not simply an address problem; it’s also a technical failure. And making this mistake can cause deliverability problems down the line.
How much are we talking about in terms of list hygiene? It’s more about when than how clean it is. You collect addresses over time. A person leaves their company, which means they don’t get forwarded anymore. They abandon their personal email or just let their domain lapse. Then you go to send them an email again… and they’re a hard bounce.
The calculator uses this estimated invalid address rate and a hygiene score to help determine if it’s better to pause or scale up. But if that number goes down, turning up your volume will only make it worse; you’re feeding bad data into those provider algorithms too quickly for them to adapt and catch up. So rather than sending more to a dirty list, you should of send less to a clean list.
To keep your deliverability rates high, you need to monitor them regularly. For example, nurtured newsletters have fewer problems to deal with than cold outbound campaigns. The prospect list is likely unverified. You have role accounts hiding in plain sight. There are also all sorts of other syntax errors that stand out once you start sending emails from them. Naturaly, there’s more expectation for bounces here, so the risk weighting of your presets will account for that (for example, for a product launch or trial onboarding).
If you’re seeing better-than-expected results compared to those benchmarks, it’s a good sign that your acquisition source is healthy; otherwise, it’s probably leaking. Don’t hit the same hard bounce more than once and don’t hit it more than one percent of your total send load or you’re done… No matter how much try again you attempt. Providers will flag you as negligent for repeatedly bouncing off non-existent mailbox addresses. Sending in bulk to lots of role account (for instance) will make this happen immediately. So use segmentation to isolate risky imports before blasting them to your whole domain.
Remember: We’re not looking for zero bounces here, as that means you’re no longer reaching inactive or new users. Typically, the healthy range is between 1-2 percent total, while hard bounces should be held below half a percent. Maintaining this will take some vigilance. Clean out failures in real-time. Don’t let last week’s cleanup spill over into the next campaign. Segment out risky imports before blasting to your entire domain. It’s just math; it takes effort to maintain the discipline. The source says to remove failures immediately after they occur rather than waiting for the next campaign.
Trust is a valuable currency in email. Email deliverability is built on trust, and trust is fragile. You earn that trust by protecting their experience and respecting inbox standards. The calculator helps you measure impact; you’re responsible for the source. Respect the retry limits, monitor the blocks and keep the list clean. If you keep on top of it, your sends will land where they belong. You won’t see tech-related engagement as actual engagement in your metrics. Sometimes the only difference between a healthy sender and a flagged one is letting the good stuff flow while cutting off the dead weight ASAP. Long term, the secret is proactive management.