Query Bytes Scanned Calculator
Estimate bytes scanned per query, monthly scanned terabytes, savings from columnar formats and pruning, cache impact, and bytes cap risk for analytics workloads.
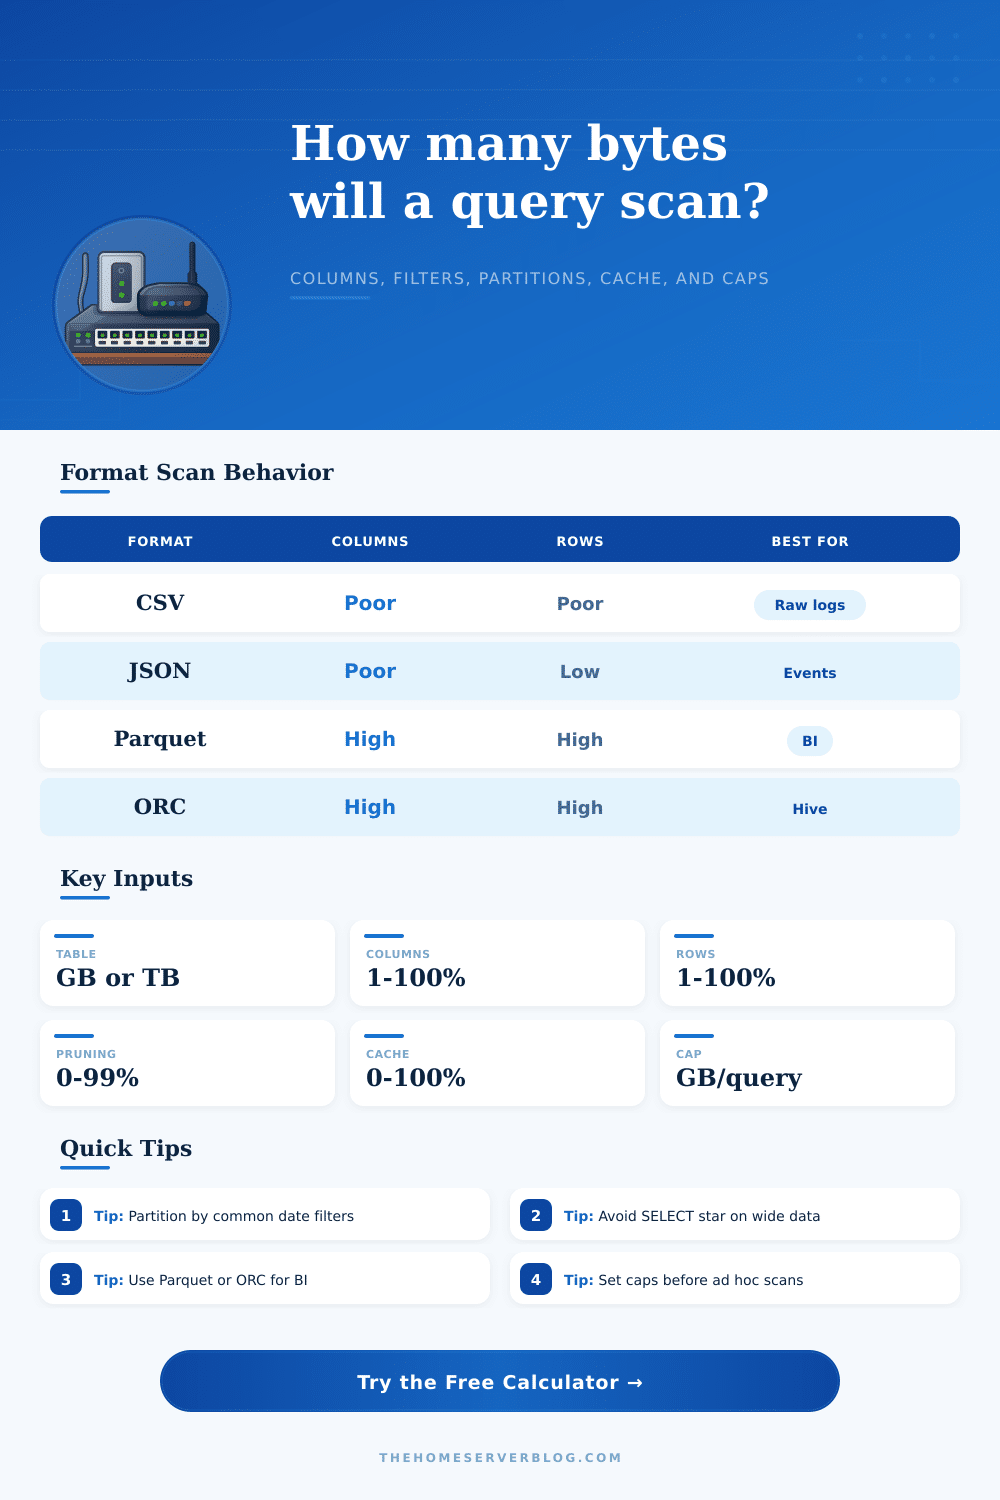
| Format | Column Skipping | Predicate Skipping | Typical Compression | Scan Notes |
|---|---|---|---|---|
| CSV | Very low | None or minimal | 1.0x to 2.5x with gzip | Usually scans full files even for few columns. |
| JSON | Very low | Low | 1.5x to 4x with gzip | Flexible, but parsing overhead is high for analytics. |
| Parquet | High | High with stats | 2x to 8x | Strong default for Athena, Trino, Spark, DuckDB, and warehouses. |
| ORC | High | High with stripes | 2x to 8x | Often excellent for Hive-style data lakes and heavy scans. |
| Engine | Bytes Metric | Pruning Strength | Cache Behavior | Best Guardrail |
|---|---|---|---|---|
| Athena / Trino | Data scanned | Partition and column pruning | Limited result reuse by setup | Workgroup bytes scanned cutoff |
| BigQuery | Bytes processed | Partition, cluster, column pruning | Result cache can avoid billing | Maximum bytes billed |
| Snowflake | Micro-partitions read | Micro-partition pruning | Result and warehouse cache | Warehouse size plus query limits |
| Spark SQL | Input bytes read | Partition, column, stats filters | Memory or disk cache if persisted | Job alerts and file layout checks |
| DuckDB | File bytes read locally | Parquet pushdown is strong | OS and process cache | Local disk and memory ceiling |
Plug in your filtering strategy and your table size into the calculator above. The calculator will do the work for you so you don’t have to guess about whether or not your partitioning scheme work. Before diving into the reason that inputs matter, we should explore what happens when you put pressure on different formats.
When you run analytics on CSV files, you pay for each character in every row. Even if you only need customer ID column, you’re still paying for every character because there’s no internal structure to skip any data. CSV is just a text format it reads left to right and top to bottom regardless of your intentions.
How to Save Money on Data Scans
But then there’s how queries work, and when you switch to columnar formats such as ORC or Parquet, it flip everything on its head. Columnar stores saves each column separately, so the engine can skip over all unneeded ones. So if you have a table with fifty columns in it, but your report requires only three, maybe a columnar scan will touch just one percent of data consumed by a row-based format. And that’s the first big lever for controlling costs. Tweak the columns percentage in the calculator and you’ll see how that reduce the workload. Drop it from a hundred down to twenty, and you’re modeling exactly what these new data warehouses promise: greater efficiency.
Half the problem is column skipping. The other half is row filtering, which rely a lot on how your data is clustered and partitioned. To partition your table means that you’ve split it into manageable chunks (e.g., by date or by region) so you can slice and dice it as needed. When you ask for last month’s sales in Europe, you want the engine to skip over all the files from January-December (except November), and you don’t care about Asia/Americas at all. If not pruned, the engine will scan the entire dataset looking for a single piece of information.
It gets more realistic when you factor in things like compression ratio and cache hits as inputs. Compression reduces physical file size, reducing the number of bytes that flows through the CPU pipelines and over the network. With a good compression ratio you may have a big logical table (on paper), but it fit into a reasonable amount of space when scanned.
A cache hit represent the best case scenario. It keeps frequently used blocks in memory or remembers results from a previous calculation. Having a high cache hit rate is akin to paying for storage instead of compute.
A lot of teams discover the byte cap way too late, it’s a danger zone. To keep their accounts from going broke by runaway jobs, most cloud providers lets you specify a maximum number of bytes that can be returned in each query. Getting close to that cap feels like yanking on the emergency brake while driving downhill, it puts an end to the bleeding, but it also brings everything to a stop. If you’re finding yourself repeatedly bumping against the cap, your data model is broken different than your SQL skills. You should of checked earlier.
The calculator has a cap status check because getting close to the cap is like coming up against the wall at top speed. We don’t want anyone to do that.
Scanned bytes are a matter of being disciplined about data architecture. They makes you consider what people will want to do with it ahead of time. They make you think about access patterns when you’re ingesting stuff. Partition on date if people often filter by date. Drop/archive seldom-used columns. Minimize the database engine’s behind-the-scenes work. Make your query habits match your storage structure. Costs drops automatically. You trust the numbers instead of worrying about the bill.