Queue Processing Time Calculator
Estimate queue drain time from service time, workers, worker concurrency, retries, dead-letter exits, autoscale ramp, incoming arrivals, and target clear time.
Jobs already waiting when the drain plan starts.
Pods, consumers, processes, or queue runners active now.
Average processing time in milliseconds after dequeue.
Parallel jobs each worker can safely process.
Extra attempts as a percent of original jobs.
Jobs that exit to DLQ instead of consuming full retry work.
New jobs per second while the backlog is draining.
Minutes available to clear the starting backlog.
Time to reach the configured worker count from half capacity.
Approximate starting worker fraction during scale-out.
Accounts for locks, I/O waits, polling gaps, and scheduling.
Used for required worker and Little's Law planning.
Worker slots divided by average service time, after efficiency.
Starting backlog plus retries, minus dead-letter exits.
How fast the system clears old work after new arrivals.
Expected in-system work at current arrival rate and service time.
Half
0 minCalculated after input changes.
Current
0 minCalculated after input changes.
Target
0 minCalculated after input changes.
Double
0 minCalculated after input changes.
| Formula | Meaning | Calculator Use | Planning Note |
|---|---|---|---|
| L = lambda x W | Average jobs in system | Arrival rate times processing time | Use stable arrival windows. |
| mu = 1000 / service ms | Jobs per second per slot | Converts service time to throughput | Measure p50 and p95 separately. |
| rho = lambda / capacity | Utilization | Arrival pressure against workers | Delay rises sharply near 1.0. |
| Drain = backlog / (capacity - lambda) | Clear time | Backlog drain ETA | Only valid when capacity beats arrivals. |
| Workers = demand / per-worker rate | Scale target | Required workers for target clear | Round up to whole workers. |
| Utilization Band | Queue Behavior | Observed Symptom | Action |
|---|---|---|---|
| Below 60% | Easy drain | Backlog falls quickly | Keep normal autoscale. |
| 60% to 75% | Healthy busy | Small ETA variance | Good steady-state target. |
| 75% to 85% | Watch zone | Retries affect ETA | Add headroom or reduce retries. |
| 85% to 100% | Near saturation | Backlog clears slowly | Scale before incidents. |
| 100% and up | Unstable | Backlog grows | Increase capacity or shed load. |
| Workload | Typical Service Time | Concurrency Pattern | Drain-Time Concern |
|---|---|---|---|
| Webhook delivery | 50 to 250 ms | High I/O concurrency | Retries can multiply load. |
| Email or push notification | 80 to 400 ms | Moderate per-worker slots | Provider throttles change service time. |
| Image processing | 500 to 2500 ms | Low CPU concurrency | CPU saturation hurts all workers. |
| ETL transform | 1 to 20 seconds | Often one job per worker | Target windows need batch sizing. |
| Cache warmup | 20 to 150 ms | High parallelism | Arrival rate may be scheduled bursts. |
| Retry Pattern | Added Work | Dead-Letter Role | Practical Limit |
|---|---|---|---|
| No retry | 0% | Only terminal failures | Fastest drain, more lost work. |
| Gentle backoff | 5% to 15% | Filters poison messages | Good for webhooks and email. |
| Standard retry | 15% to 40% | Stops infinite attempts | Watch provider or DB limits. |
| Incident retry storm | 50% and up | Critical safety valve | Pause, cap, or route bad jobs. |
| Preset | Starting Backlog | Service Time | Workers x Concurrency | Main Risk |
|---|---|---|---|---|
| Email Digest Jobs | 50,000 | 180 ms | 12 x 4 | SMTP/provider pacing |
| Webhook Fanout | 120,000 | 80 ms | 18 x 8 | Retry amplification |
| Image Thumbnails | 18,000 | 900 ms | 10 x 2 | CPU saturation |
| Nightly ETL Batch | 650,000 | 2500 ms | 80 x 1 | Batch window miss |
| Cache Warmup | 300,000 | 45 ms | 24 x 12 | Origin overload |
The queue depth grows incrementally over time while you’re looking at your dashboard stats and they seem unchanged. Is something going wrong? Are the systems bogged down with requests? How will you know when you need a new machine or some differant code?
Enter numbers for workers and their servicing times into the calculator. Let it crunch the numbers for you.
Using Numbers to Plan Your System Size
Backlog size isn’t as important than the service time per job. That figure indicate how long a single unit of work actualy takes to process after it leaves the queue. It’s not the same thing as wait time, which is what people tend to mix up. Wait time = queue length; service time = duration of labor needed to complete the job.
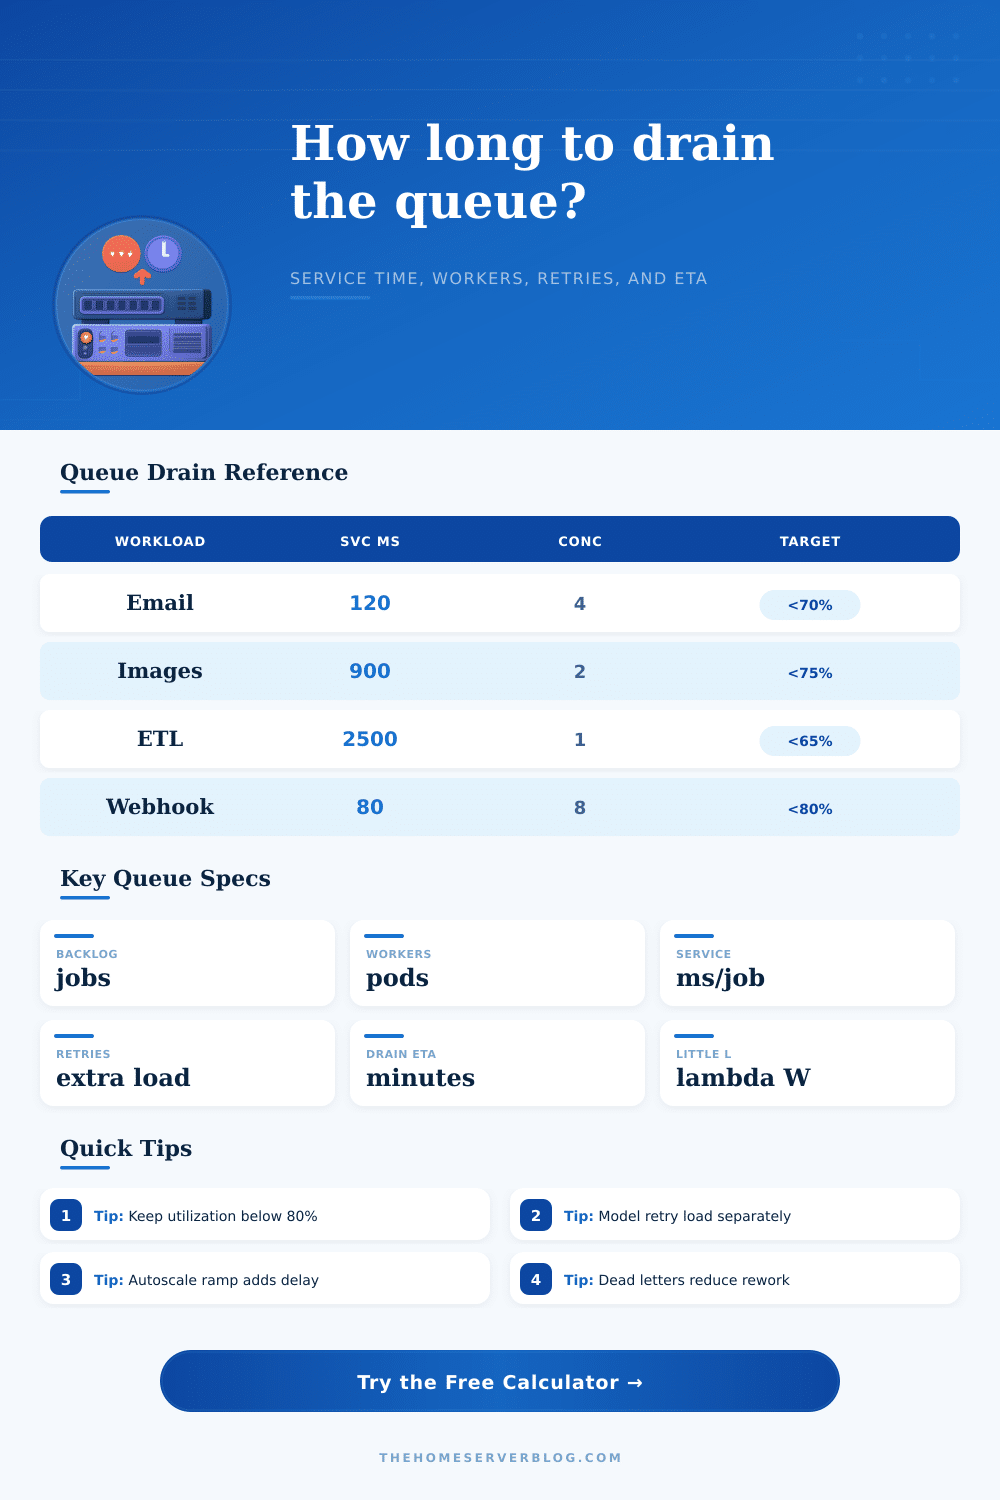
You’ve got ten workers, and each job requires two seconds. How fast can they drain? There are only so many per minute. That’s simple arithmetic … but it has complex results, which is why it is important to measure service time accurately. This shifts things when you’re running concurrent workloads. You can get more work done with fewer workers thanks to today’s infrastructure. For example, one worker might be able to do several jobs at the same time. For example, maybe you have 12 pods, each of which run four tasks at once.
Because of this multiplier effect, under-estimating concurrency means you will think you require more workers than you actualy need. Even worse is over-estimating it; for example, you may blow out your threads or exhaust your CPUs because the model thought the load was light when it actualy wasn’t.
Retries are another reason estimates go awry. Ten percent seems like a low failure rate. But that’s one out of every ten jobs failing. Those failed jobs then retry, so you suddenly have two out of every ten jobs. Or 20% of the original load. Back on the conveyor belt. That’s additional weight for the calculator to add to your effective job count. Account for model retries or you’ll get an optimistic, incorrect estimate of your ETA.
How many poison messages can the queue withstand before it rots? Know your dead letter volume. However, scaling isn’t instant. New instances spin up when traffic spikes, but those instances begin empty. They don’t have any cold connection or warm caches. There’s a lag as demand exceeds supply while newly spun up instances ramp up. To account for this friction, there’s a field in the tool for autoscale ramp minutes. It recognizes that capacity doesn’t magically emerge, so it has to takes some time to get its act together.
Here’s the grounding truth: Little’s Law. On average, the number of items in the system is equal to the arrival rate x the average time spent in the system. Slow your processing and you gets more items in the queue. More items in the queue mean longer wait times. This creates a feedback loop that feeds on itself.
The reference tables shows how usage bands bend behavior. At less than sixty percent things just flow along nicely. At more than eighty-five percent, variance goes nuts and every little bump in traffic results in huge spikes in wait times.
This tells you how long it would of take to drain the queue if your service was running at peak capacity. This is an early signal you want to see so you can start scaling up. By the time the alert fires the queue is likely pretty deep, and it’ll take several hours to clear at max capacity. By doing some of this math in advance, you can size your infrastructure ahead of time so you can plan based off business needs and not just technical constraints.
What’s your “clear” time target? Based on this data, what do you think is a reasonable time to clear out the queue? It’s honest about trade-offs. There are no free lunches: there’s no such thing as unlimited use at zero latency; no such thing as zero use at unlimited speed. Pick your poison. Fast drain or steady state efficiency + occasional backlog? Know what those are worth. The tool does not remove the guessing out of capacity planning; instead, it gives you the numbers to make that conscious decision.
Managing queues takes precision and patience. All those milliseconds spent serving a job add up to thousands of jobs, and each retry multiplies your effort through repetition. And it’s about creating a system which treats these limits as part of its design rather than an enemy to be overcome. Eventually it will drain. But do you want to plan for the flow or wait until the water starts to rise?