Database cursor batching planner
Cursor Batch Size Calculator
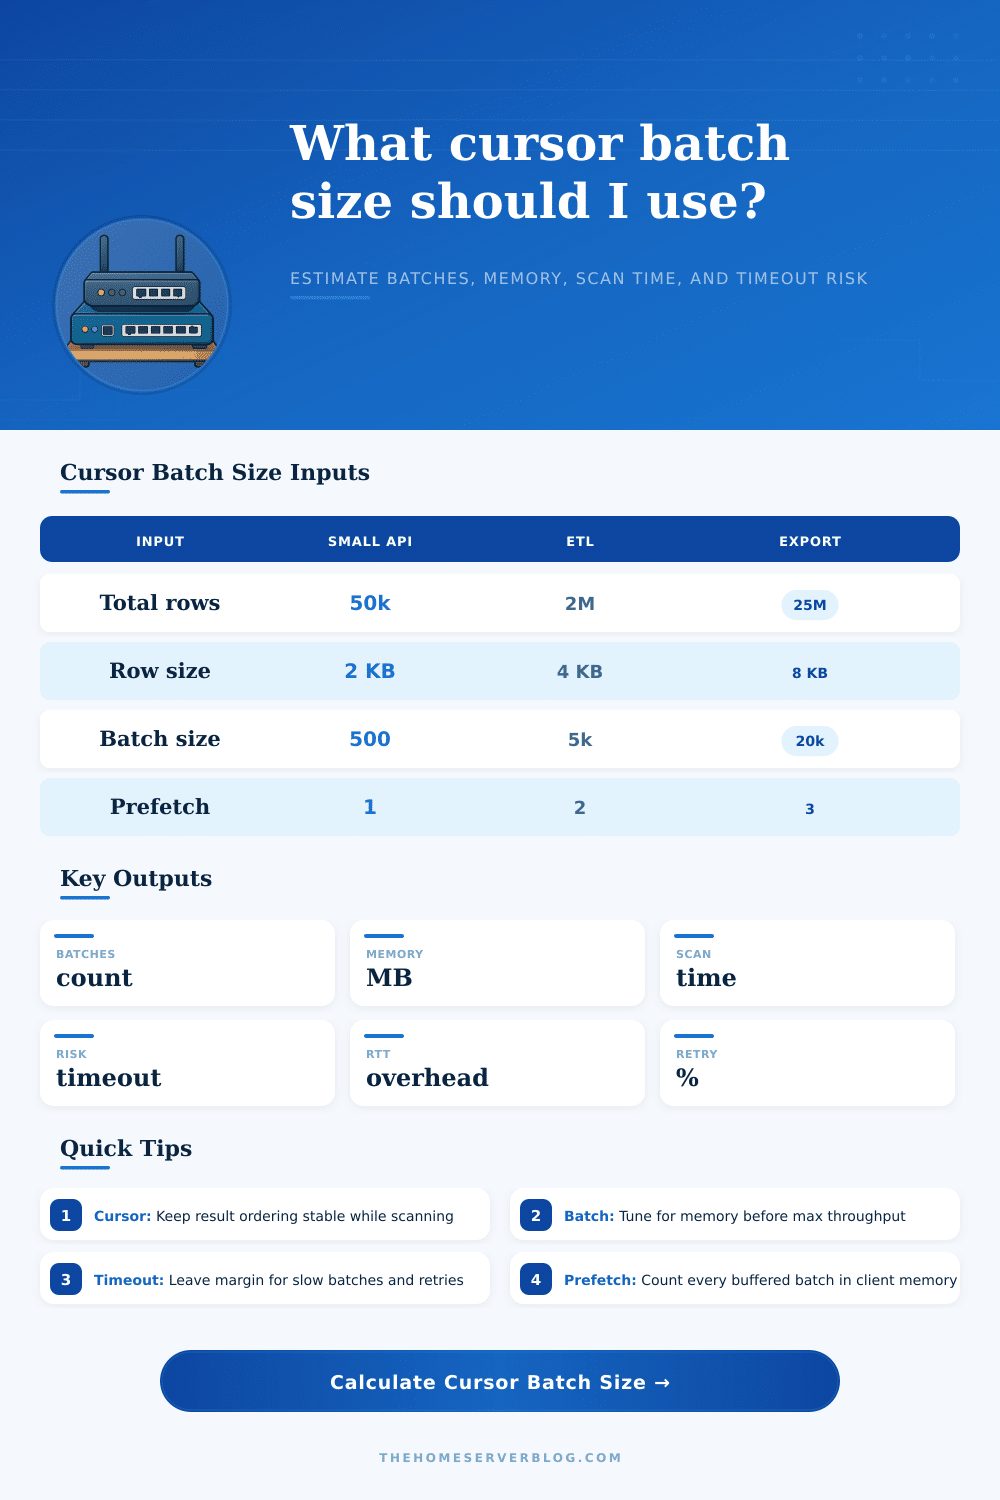
Estimate how a cursor fetch size changes batch count, client-side memory, network round trips, server row processing time, retry overhead, and timeout risk for long database scans.
Calculation breakdown
Memory and timeout margin
Batch count
Larger cursor batches reduce fetch calls and network RTT overhead, but they increase memory pressure and the amount of work lost when a batch fails.
Payload memory
The calculator treats client memory as batch size times row size times prefetch batches, with a modest object overhead factor for decoded rows.
Scan duration
Total scan time combines per-fetch latency with server-side row processing, then applies expected retry attempts from the configured retry rate.
Timeout risk
Risk rises when total scan time approaches the timeout, or when one large batch can sit too close to socket, scroll, or transaction limits.
| Preset | Total rows | Row size | Batch | Prefetch | Typical goal |
|---|---|---|---|---|---|
| PostgreSQL Cursor Export | 2,000,000 | 4 KB | 5,000 | 2 | Stream result sets without loading the full query into application memory. |
| MongoDB Batch Read | 750,000 | 6 KB | 1,000 | 2 | Keep document batches moderate while moving large BSON payloads. |
| Elasticsearch Scroll | 5,000,000 | 2 KB | 10,000 | 1 | Reduce scroll calls while respecting heap and scroll context pressure. |
| API Pagination Cursor | 120,000 | 3 KB | 500 | 1 | Keep API page responses small enough for gateway and client timeouts. |
| Data Warehouse Extract | 25,000,000 | 1.5 KB | 50,000 | 2 | Favor throughput when rows are narrow and the network path is stable. |
| CSV Export Job | 1,500,000 | 2.5 KB | 8,000 | 2 | Balance CSV writer buffers with steady database fetches. |
| Admin Grid Infinite Scroll | 80,000 | 5 KB | 100 | 1 | Keep interactive scrolling responsive with small result pages. |
| ETL Incremental Sync | 3,500,000 | 3.5 KB | 12,000 | 3 | Feed downstream transforms while avoiding oversized client buffers. |
| Queue Backfill Cursor | 10,000,000 | 1 KB | 20,000 | 2 | Move IDs or small payloads quickly into a worker queue. |
| Formula | What it means | Why it matters | Watch point |
|---|---|---|---|
| Batches = ceil(total rows / batch size) | Number of cursor fetch calls needed. | Each call pays network RTT and driver overhead. | Very small batches amplify latency. |
| Batch MB = rows per batch x row KB / 1024 | Serialized payload for one batch. | Shows the minimum buffer size before object overhead. | Wide rows can surprise app memory. |
| Prefetch MB = batch MB x prefetch x 1.18 | Buffered client memory with decode overhead. | Approximates memory used by drivers that prefetch or decode rows. | Use lower prefetch on small workers. |
| Scan sec = RTT attempts + row work + retry overhead | Expected end-to-end cursor scan duration. | Separates latency-bound scans from CPU-bound scans. | Retries can turn long scans into timeout failures. |
| Batch size symptom | Likely cause | Tuning move | Good validation metric |
|---|---|---|---|
| High RTT share | Too many small fetches across a distant network. | Increase batch size or run the worker closer to the database. | Network time falls as a percent of total scan time. |
| Memory pressure | Wide rows plus aggressive prefetch or decoded objects. | Lower batch size, lower prefetch, or project fewer columns. | Resident memory remains below the worker budget. |
| Timeouts near the end | Total scan time exceeds socket, job, transaction, or scroll TTL. | Raise timeout, checkpoint by cursor token, or split the scan. | Timeout utilization stays under 70% in normal runs. |
| Long retry recovery | Batch units are too large to replay cheaply. | Reduce batch size or persist progress after each successful batch. | One failed batch replays in seconds, not minutes. |
| Timeout risk band | Total scan vs timeout | Memory use | Recommended action |
|---|---|---|---|
| Low | Under 50% | Under 50% | Batch size is likely workable. Verify with production-like row widths. |
| Medium | 50% to 80% | 50% to 80% | Add timeout margin, reduce prefetch, or checkpoint between ranges. |
| High | 80% to 100% | 80% to 100% | Split the cursor scan or lower batch size before deployment. |
| Critical | Over 100% | Over 100% | The run is expected to fail without more time, memory, or smaller work units. |
PostgreSQL
Knobs: server-side cursor, fetch size, autocommit off. Keep transactions short enough for vacuum and idle timeout policies.
MySQL / MariaDB
Knobs: streaming result sets, fetch size, net read timeout. Avoid buffering the whole result set in the connector.
MongoDB
Knobs: batchSize, projection, cursor timeout. Large documents make memory the first constraint before fetch count.
Elasticsearch / OpenSearch
Knobs: scroll size, search_after, PIT keep_alive. Prefer search_after for deep stateless pagination where possible.
SQL Server
Knobs: SequentialAccess, packet size, command timeout. Narrow SELECT lists help avoid large object buffering.
API Cursor
Knobs: page size, next token TTL, gateway timeout. Keep each page small enough to retry safely.
It might happen that you’ve started a data export job that’s working as expected for an hour. But then it fail. The dashboard say the job is running. There are no logs. And then connection times out… with a generic timeout error.
If you’re like me, this happens in database engineering a lot and it always feels like it’s not realy your fault. Your query was fine. The server wasn’t down. But somewhere between your application memory and the database engine, someone made an assumption about how much data there would be.
How to Pick the Right Cursor Batch Size
To make that real we need a few assumptions about cursor batch size. That is the number of rows you pull in one round trip over the network. What does that mean? It control latency overhead and memory pressure. Set it too high and the client buffer can fill up. Set it too low and you’re waiting on packets when you could be working with data.
Once you know your network conditions and row counts, the calculator will do the math for you (saving you the guesswork of the correct retry penalty & memory overhead factor).
When we begin, our batch size is arbitrary, a thousand rows seem reasonable. A lot of times it’s too small. That one fetch could cost the server fifty milliseconds in a high delay environment. Now you’re trying to scan two million row. All those little requests becomes hours of just sitting around for your system and the server’s system, each idling away. Network chatter becomes your bottleneck instead of compute power. Each round trip is costing you a tax and the smaller your batches the more expensive that tax get.
There’s a catch: memory usage. Every row fetched occupy space in the client buffer until it is processed and discarded, and decoding overhead can easly double that raw payload size. These rows stay in memory until they are consumed and deleted. Embedded objects or long text column make this worse quickly on wide rows. If you’re running low on memory, well, you thought you had more than enough RAM for that worker process. Decoding those BSON or JSON structures can easly double the raw payload size. When it fails silently with an out-of-memory exception halfway through a big export job, that is a problem.
The picture gets even more complicated when we add prefetch into the mix, most drivers fetch multiple batches in advance, which keeps CPU busy while waiting for a new network response. So your memory footprint isn’t simply equal to the batch size. It’s usually twice or thrice that much, including overhead for objects. That’s where the table on the page comes into play: it illustrates how these constraints are balanced across different kinds of workloads.
Notice that ETL jobs can afford bigger batches since they execute within a controlled environment (with generous timeouts & dedicated resources). On the other end, API endpoints has to remain small so as not to hang user-facing connections, nor breach gateway limits.
Finally, there’s the ultimate constraint: timeouts. If you run too long, you hit a hard wall and the whole thing comes crashing down. If you have 300 second timeouts, then a 90 second scan is no problem at all. But as the network spikes and pushes that up to your timeout window, suddenly that’s a critical issue. This is especially true given retry overhead. When batches fail, the system has to re-fetch the data or restart work from its last checkpoint. That chews through your available time pretty fast.
It’s more about knowing what you’re measuring. It’s not just about how fast it go. It’s about how stable it is while things change. So determine the maximum amount of memory you have and the biggest rows you can get away with. Backwards from there, figure out the maximum batch size where it never stutters because of network issues or garbage collector pauses. And then prove it with real data distribution in a staging environment (as opposed to synthetic testing). Real load cases has edge cases which expose bottlenecks you didn’t see coming early on.
But all in all, that’s what cursor batching comes down to: setting expectations of communication from two very different systems with different rates of speech. The first wants to say everything all at once; the second needs time to catch its breath while it processes it all. Nailing the sweet spot between choking and starving is how a precarious export script becomes a stable data pipeline. It handles server load spikes, network blips, and doesn’t require any human intervention. And that’s something you should of figuring out well before you hit “run”.