Home lab block volume capacity, snapshots, and performance density
Block Storage Capacity Calculator
Size a VM disk, PVC, database volume, media volume, scratch disk, or replicated block device by checking usable GB, snapshot delta storage, IOPS per TB, throughput density, and resize timing.
Capacity breakdown
Utilization status
Good for single-host Proxmox labs. Thin provision carefully and keep free pool space visible.
Use volblocksize and recordsize planning for databases, VM images, and snapshot-heavy volumes.
Replicas multiply raw footprint while giving live migration and host failure tolerance.
Works well for hypervisor datastores when network latency and multipath are kept predictable.
Best for fast fabrics where throughput, queue depth, and CPU overhead are monitored together.
IOPS and throughput often scale separately from GB, so watch density as volumes get smaller.
| Workload profile | Typical volume | IO pattern | Sizing watchpoint |
|---|---|---|---|
| VM boot and package cache | 40-120 GB | Small random reads | High IOPS density on small disks |
| PostgreSQL data and indexes | 200 GB-2 TB | Mixed random IO | WAL, checkpoints, and snapshots |
| Docker registry backing store | 300 GB-3 TB | Layer reads and writes | Garbage collection reclaim timing |
| Analytics scratch volume | 500 GB-8 TB | Large sequential scans | Throughput per TB and temp growth |
| Snapshot policy | Daily change | Retention | Capacity signal |
|---|---|---|---|
| Light VM rollback | 1-2% | 7 days | Small but persistent delta |
| Database staging | 3-8% | 14 days | Plan for write bursts |
| Media or sync volume | 1-5% | 30 days | Deletes may stay in snapshots |
| Build cache scratch | 10-25% | 3 days | Short retention avoids bloat |
| IOPS per TB | Planning meaning | Common fit | Action |
|---|---|---|---|
| Under 1,000 | Capacity-led volume | Archives, backup repos | Prioritize sequential bandwidth |
| 1,000-6,000 | Balanced block storage | General VM disks | Track latency during peaks |
| 6,000-20,000 | Performance-led volume | Databases, queues | Check queue depth and cache |
| Over 20,000 | Very dense target | High-IOPS databases | Validate device and network limits |
| Throughput density | Typical symptom | Best volume style | Watch |
|---|---|---|---|
| Under 100 MB/s/TB | Capacity pool | Large media or backup LUN | Rebuild and scrub windows |
| 100-500 MB/s/TB | General mixed IO | VM datastore or PVC | Shared host bandwidth |
| 500-1,500 MB/s/TB | Scan-heavy workload | Scratch or analytics volume | Sequential saturation |
| Over 1,500 MB/s/TB | Small fast volume | NVMe-backed block | CPU, queue depth, and latency |
At some point in your homelab, your disk light won’t blink; it’ll just sit there. And you know what? That’s bad news. Everything stop working. Maybe you had grand ideas once (like dedicating fifty gigs to a VM because that seemed like plenty at 2am) but now it’s the middle of the night, you’ve logged into your server again, and your database grew all day long. Or maybe you accidently ran a log dump and then another update cycle hit. Suddenly, block storage doesn’t care how much you planned on storing. Block storage cares about blocks, and when those blocks are gone, everything else go too.
To address this problem (and avoid any panic in the first place), I’ve created a calculator on this page that makes you look at your volume’s claimed size versus its true size. Ninety-nine times out of a hundred, admins over-provision their drives, thinking about peak usage as opposed to steady state utilization. They fill a drive to ninety percent because they want to save money on unused space. That’s a risky gamble. You don’t want a filesystem running out of air; you want to have reserved blocks set aside to ensure that writes aren’t hitting a wall and clogging things up. The tool reflects that with a question: how much reserve percentage do you want? Answering that causes all the magic smoke to escape, revealing just how much usable capacity are available for actual data expansion.
How to Plan Your Storage Space
Intuition also breaks down on snapshots. Until someone experiences a big backup window, everyone think they understand copy-on-write efficiency. They imagine a static archive that costs nothing to take a daily snapshot of. Turns out each changed block gets stored individually. And if your database churns three percent of its data day-in, day-out, then those changes add up quickly. Use the calculator: multiply your estimated daily change by your retention period to get total gigabytes of snapshot storage overhead. That specificity helps prevent the shock when an otherwise routine restore test discover your backup repository ate up all available space.
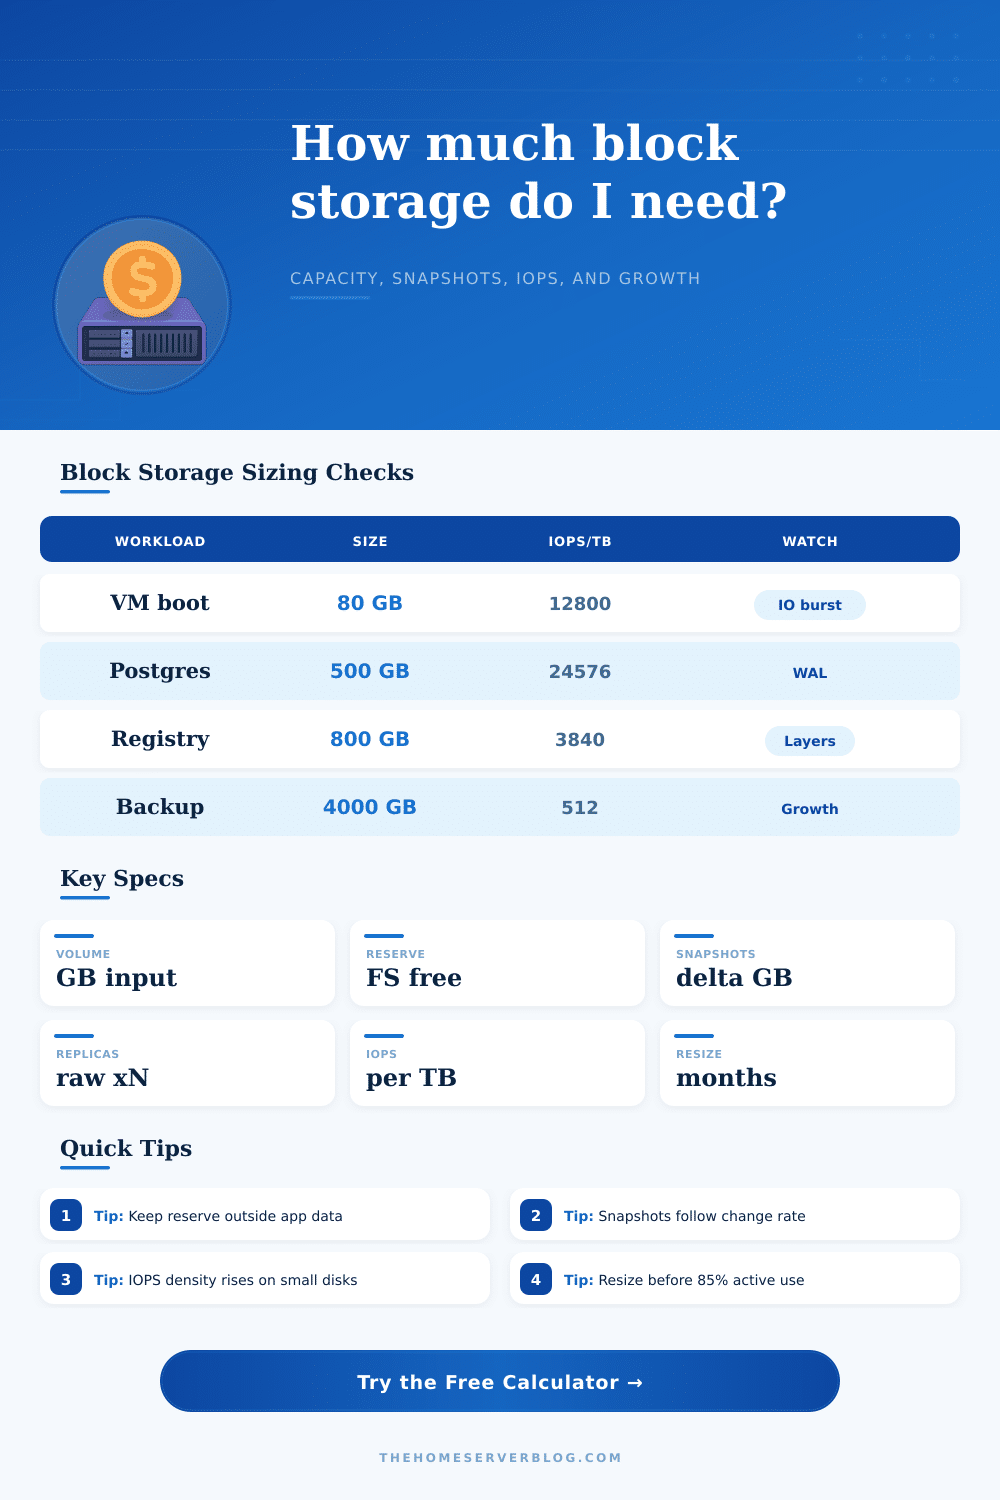
Similarly, we shouldn’t have to calculate performance density in our heads either. A tiny disk might not seem like much of a problem (until it require high IOPS). Then the density required per terabyte goes through the roof. Consider a boot drive requiring twelve thousand operations per second on an eighty gigabyte disk. This creates an intense load on a tiny footprint. To call out when you’re asking too much of a given volume size different than its performance tier, the tool includes a calculation of IOPS per terabyte. It can help you know whether to add another spinning volume, or whether to invest instead in something faster such as NVMe over Fabrics for your backend media.
Once more into replication: Your raw storage size multiplies when replicated. A seemingly modest two-hundred-gigabyte PostgreSQL database volume isn’t so trivial anymore. With high-availability mirroring, it’s consuming four hundred gigabytes of physical disk space. That hidden cost becomes instantly visible in the calculator. It makes you think about the logical presentation from the guest OS, but more importantly the actual backend reality. Oversubscribing your storage pool by ignoring the multiplier result in silent failures at peak load.
But here’s how they tie it all together: they use growth projections. Rather than waking up at 3am to an alert email that your storage is nearing capacity, the tool tells you when you’ll reach eighty-five percent usage (in a few months). You can then plan out expansions around regular work hours or before a big release cycle. Storage management becomes less about firefighting and more about planning ahead.
Below the main inputs are some reference tables to help put common workloads into context. Do your guessed numbers make sense? For example, what is the typical IO pattern of analytics scratch disk vs a Docker registry? The tool helps separate those concerns. Does a transactional database look anything like a media server? Run these scenarios through the calculator, and go beyond guessing. Storage starts looking more like a series of predictable variables instead of a mysterious black box that randomly runs out of space.
Block storage management means acknowledging that reality… That there’s physics to this medium, and it requires some respect: Leave some room for error, account for change, and remember that physical cost is never equal to logical size. The gigabytes you’re counting on aren’t realy gigabytes; they’re a sense of security that comes from plugging those numbers into the tool, knowing that someday the disk light will stop blinking.