HomeServerBlog backup capacity tool
Point-in-Time Recovery Size Calculator
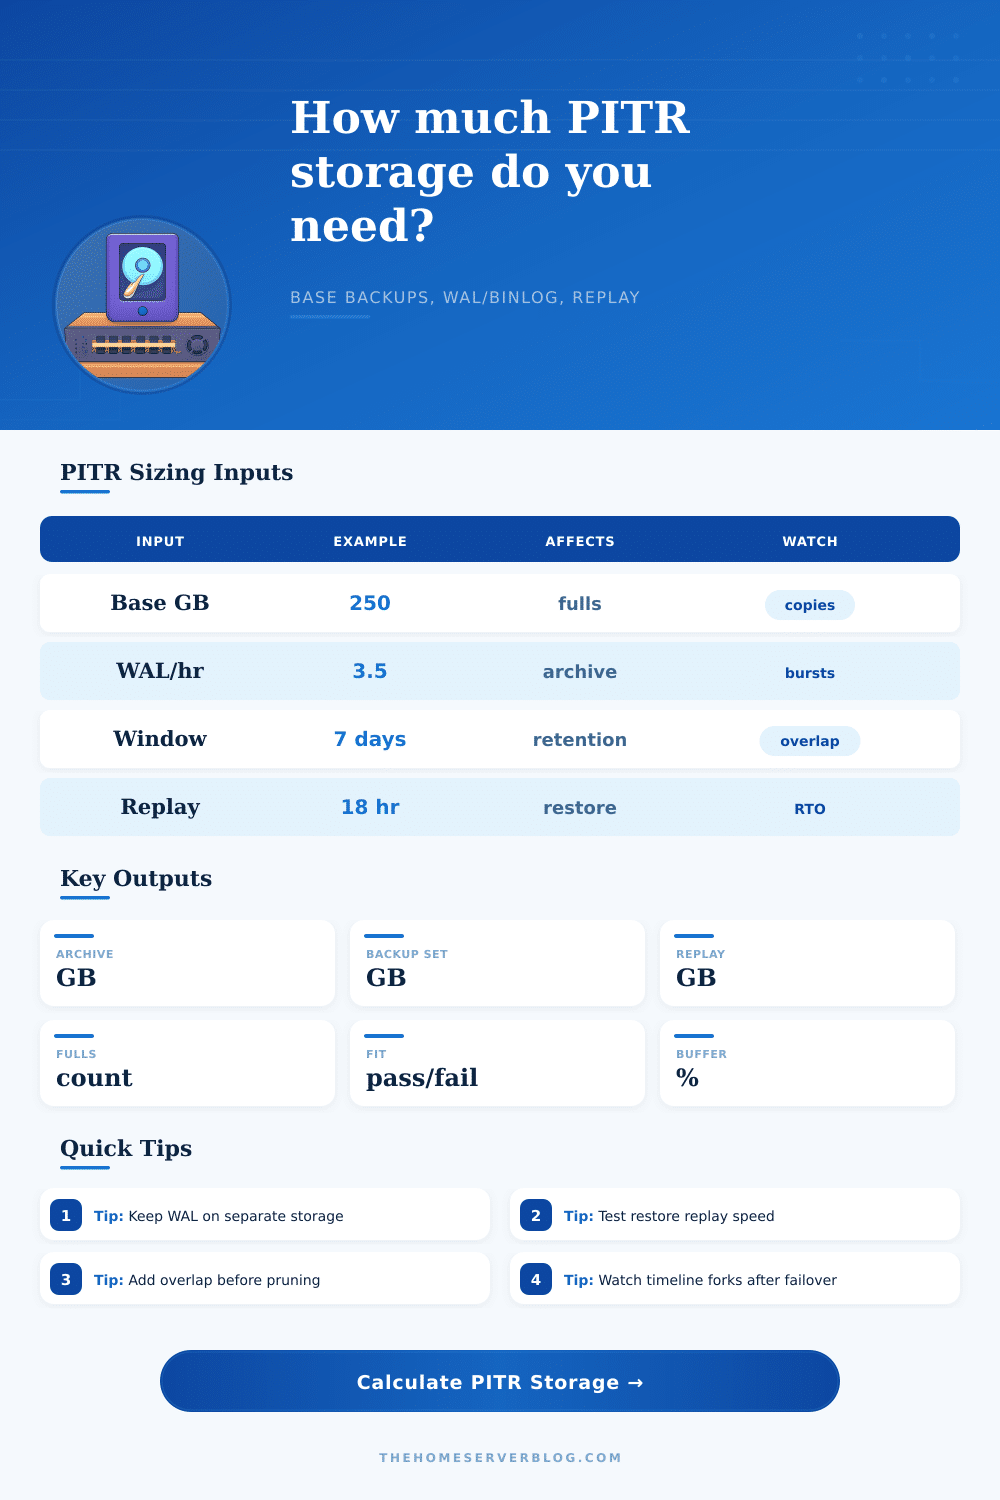
Estimate the storage footprint for database PITR using base backup size, WAL or binlog rate, recovery window, compression, full backup cadence, overlap retention, timeline forks, replay target age, and safety buffer.
Calculation breakdown
Count required to cover the requested PITR window and retention overlap.
WAL or binlog generation before compression and safety reserve.
Portion of backup bytes left after the compression setting is applied.
Average backed-up footprint per retained calendar day.
Full Backup Only
Coarse recoveryStores complete backup images but can only return to a backup time unless another log method exists.
Differential Chain
Lower replayReduces some restore work, but still needs careful chain retention and periodic full backups.
PITR Archive
Fine restoreCombines a base backup with WAL or binlogs to recover to an exact target timestamp.
Replica Snapshot
Fast anchorUseful for a hot baseline, but snapshots alone do not replace log archive retention.
| Formula piece | Calculator logic | Why it matters | Common adjustment |
|---|---|---|---|
| Archive hours | (window days + overlap days) x 24 | Controls how many WAL or binlog hours remain restorable. | Add 1 to 3 days for pruning delays. |
| Raw archive GB | GB/hour x hours x timeline count | Timeline forks multiply archive chains after promotion or test restore. | Use peak average for write-heavy systems. |
| Compressed archive | raw archive x stored factor | Compression changes the long-tail storage cost of PITR. | Measure real WAL/binlog compression samples. |
| Total backup set | base pool + archive, then buffer | Shows the actual storage target footprint for the full window. | Keep 15% to 30% reserve for variance. |
| Workload | Typical log GB/hour | Window pattern | Sizing note |
|---|---|---|---|
| Low-write blog | 0.02 to 0.20 | 7 to 14 days | Base backups dominate storage unless media is included. |
| Home automation DB | 0.05 to 0.60 | 3 to 7 days | Metrics and recorder tables can spike writes unexpectedly. |
| SaaS OLTP | 2 to 25 | 7 to 35 days | WAL volume usually dominates after a few retained days. |
| Metrics time-series | 10 to 80 | 1 to 7 days | Compression helps, but ingest peaks drive archive pressure. |
| Full interval | 7-day PITR plus 1 day overlap | 14-day PITR plus 2 days overlap | Tradeoff |
|---|---|---|---|
| Every 12 hours | 17 full backups | 33 full backups | Short replay, high base backup storage. |
| Daily | 9 full backups | 17 full backups | Common balance for home labs and small apps. |
| Every 3 days | 4 full backups | 7 full backups | Lower base storage, more replay from older anchors. |
| Weekly | 3 full backups | 4 full backups | Cheap storage, but restores can replay a lot of logs. |
| Restore target age | Replay estimate | Operational risk | Practical check |
|---|---|---|---|
| 1 to 6 hours | Small log replay | Usually fast if archive fetch is local. | Test applying logs from object storage or NAS. |
| 12 to 24 hours | Daily write volume | Can exceed RTO on busy OLTP systems. | Measure replay MB/sec during a drill. |
| 2 to 7 days | Large replay chain | Restore may be CPU and random I/O bound. | Prefer newer base backups if available. |
| After failover | Timeline-aware replay | Wrong timeline can break the target timestamp. | Archive history files with WAL segments. |
The panic sets in when someone calls and says “oops, I accidentally dropped my tables”, then you remember your most recent full backup was made three days ago. It happens; it’s terrifying. But most often it all comes down to one misstep: you only calculated for disk space to hold your database file, not realizing that point-in-time recovery require a never-ending string of transaction log files trailing back to your starting point.
If you don’t manage those logs and they get full before you can prune them, you lose any chance at recovering, you’re stuck with a 3-day-old snapshot instead, unable to turn back time. Once you plug in your retention period and your write rates into this calculator, it’ll crunch the numbers for you. Knowing how each number affect the other, though, will help you sleep without interruption.
How to Calculate Database Backup Storage Needs
People naturaly begin with the size of their database. But what really weighs down storage bill are all the transaction logs you’ve been creating since anchor was established. Those logs adds up quickly if you is running an active application. They add up fast if you’ve got an actively used application. It’s possible you only have a twenty-gigabyte database, but if it gets two gigabytes worth of changes per hour and you need to preserve seven days of history, you’ve suddenly got terabytes of archive data different than gigs.
That difference often blows budgets or causes backups to fail quietely once storage limit is hit mid-week. Sure, compression will help, but don’t count on it behaving as expected in a high churn environment. You can add a compression percentage to both growing logs and your base images using the tool. Be realistic. A stream of random integer updates in an OLTP system won’t compress very well. Static files does.
Don’t overestimate your compression ratio. That’s a common mistake that leaves you short when the billing cycle comes around at month-end. Assume modest gains with the logs, and let the base backups do most of the work to reduce storage. The other thing is timelines, and timelines are where the mess come into play.
Your database has a single history in a clean environment. If you create a test restore or a replica on another server, then you have branched that history. Every branch creates their own set of logs which need to be kept around if you wish to recover to a particular point in time from any branch. The calculator does this by multiplying the size of your log volume by how many timelines you have.
This is a small multiplier, but if you aren’t careful about tracking your test restores, then you’ve tripled or quadrupled your storage requirements instantly. You may believe that you’re only retaining seven days of history, but with an additional two timelines you actualy have twenty-one days worth of state changes stored. Now let’s look at the retention window itself.
The default for most policies is seven days, which raises the question of what then? What about the eighth day? Suppose you find out about a corruption event on Tuesday and trace it back to a bad import last Thursday. Your seven-day window just came and went on its heels. An overlap buffer between backups provide a little more time in your retention policy to ensure that you don’t delete logs before they’re really safe to be thrown away.
It also compensates for copy lag. It takes time to transfer backups to offsite storage. By the time your local backup has completed, there may still be segments pending in transit to the remote bucket. You should of give yourself a day or two before clipping the tail. And lastly, there is the fit check.
This compares your projected total against your available capacity. If it passes you have enough; if it fails you must beg management for more disk space, shorten your retention window, or take more frequent backups so that fewer need to be replayed. There is no magic solution for physical storage constraints. Either spend money on more hardware or negotiate with management.
You can keep more history at the expense of having less. Or, you can restore faster by taking more frequent baselines which may require more disk space. And it isn’t simply about fitting all this data into a box. It’s about making sure you have the actual bytes you need to rewind time. This prevents you from hitting a wall of zero-filled disk space when things inevitabley go wrong.