HomeServerBlog Wi-Fi capacity tool
Airtime Utilization Calculator
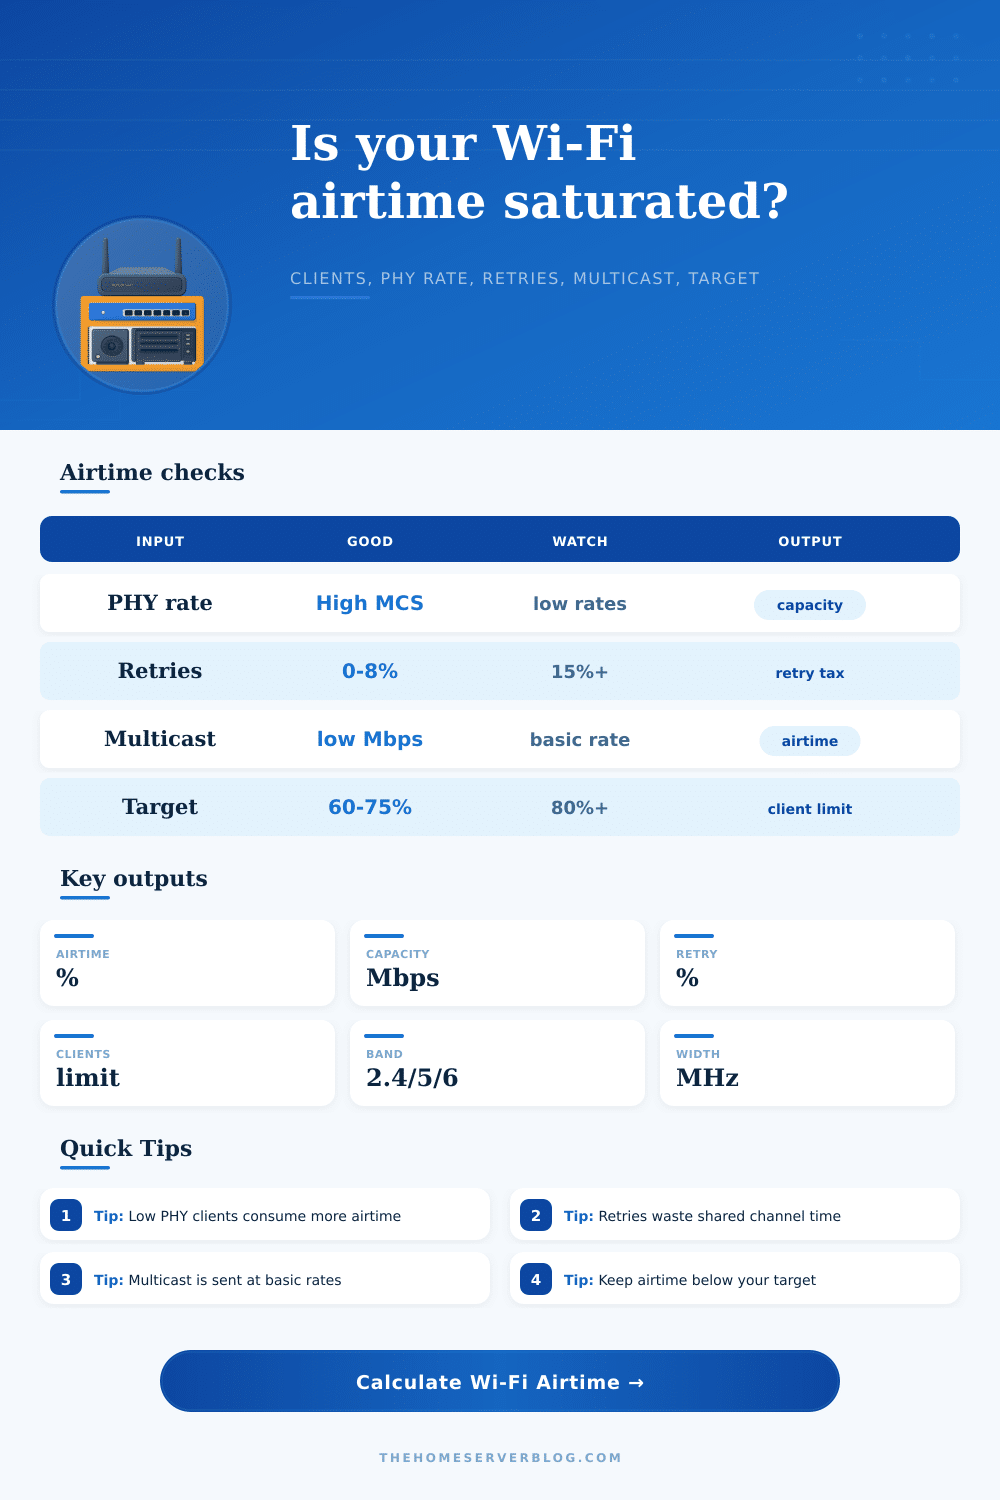
Estimate how much shared channel time your Wi-Fi clients consume after active users, PHY efficiency, retries, management frames, channel width, band behavior, target airtime, and multicast traffic are applied.
Breakdown
Target status
| Band | Base efficiency | Basic multicast rate | Planning note |
|---|---|---|---|
| 2.4 GHz | 52% | 6 Mbps | More interference, fewer non-overlapping channels, and older clients often lower airtime efficiency. |
| 5 GHz | 62% | 12 Mbps | Good default for home and office capacity when clients have healthy RSSI. |
| 6 GHz | 72% | 24 Mbps | Cleaner spectrum and newer clients usually improve usable airtime, but range is shorter. |
| Channel width | Efficiency factor | Best fit | Airtime watchout |
|---|---|---|---|
| 20 MHz | 0.96x | 2.4 GHz, dense APs, voice, IoT | Lower peak PHY but cleaner reuse and lower contention risk. |
| 40 MHz | 0.91x | Balanced 5 GHz or 6 GHz cells | Moderate capacity with manageable overlap. |
| 80 MHz | 0.84x | Fast home or office clients | High PHY but fewer clean channels and more shared noise. |
| 160 MHz | 0.76x | Clean 6 GHz or point-to-point bursts | Great peak rates, but one busy neighbor can hurt a wide slice. |
| Preset | Clients | Band / width | Retry profile |
|---|---|---|---|
| Wi-Fi 5 Home AP | 24 | 5 GHz / 80 MHz | Moderate home retries |
| Wi-Fi 6 Office | 55 | 5 GHz / 40 MHz | Managed cell, lower retry rate |
| Guest Network Busy | 80 | 5 GHz / 40 MHz | Many active clients, higher overhead |
| Classroom Tablets | 32 | 5 GHz / 40 MHz | Synchronized bursts |
| IoT Low Rate | 70 | 2.4 GHz / 20 MHz | Low PHY and higher management cost |
| Voice over Wi-Fi | 18 | 5 GHz / 20 MHz | Low Mbps but strict airtime target |
| Outdoor Mesh | 14 | 5 GHz / 40 MHz | Backhaul plus clients |
| 2.4GHz Congested | 35 | 2.4 GHz / 20 MHz | Heavy retry and multicast penalty |
| 6GHz Clean Channel | 45 | 6 GHz / 80 MHz | High PHY and lower fixed overhead |
| Symptom | Airtime clue | Likely cause | Action |
|---|---|---|---|
| Latency spikes | Utilization above target | Too many active senders | Split SSIDs across radios or add AP density. |
| Low speed near AP | Retry overhead high | Interference or bad channel | Change channel, lower width, or improve SNR. |
| Small multicast hurts | Multicast airtime high | Low basic rate traffic | Prune multicast, enable IGMP/MLD snooping, raise basic rates carefully. |
| Voice glitches | Little target margin | Jitter under contention | Use 20 MHz, QoS/WMM, and a lower airtime target. |
This calculator is a planning model for one Wi-Fi contention domain. Real AP scheduling, OFDMA behavior, MU-MIMO, rate adaptation, hidden nodes, DFS events, and neighboring BSS activity can move the final number, so compare the result with controller airtime, retry, and channel-busy counters.
Imagine this: You invited a friend over for dinner. They take out their phone, try a video call, and the music cuts out mid-way. The call disconnects. Your friend looks at you in disbelief and annoyance. Why are the Wi-Fi signal bars full? Something is off. That’s generally an airtime problem, not a bandwidth problem.
We thinks of Wi-Fi like a highway, more lanes = faster traffic. Actualy, Wi-Fi is a half-duplex system. Only one device can transmit at a time; everyone else waits until that device are done. When your friend’s device transmits slowly, that delay accumulates for every user on the network.
Why Your Wi-Fi Is Slow Even With Full Bars
Enter the calculator. Input your client count, PHY rate, and the math will be done for you (no guesswork necessary about how much busy time those devices spends).
Speed metrics, however, are not what the problem is, and they can be deceptive. Four hundred megabits-per-second might sound fast on paper, but so does six megabits on another device, which will hog the channel with each packet it transmits. Because the slow device blocks the line, it takes around seventy times longer to send its data different than a device transmitting at four hundred and thirty-three megabits. Your router has a ten-gigabit backbone? Great! But if last hop to your client is slow, shared medium gets clogged.
People don’t understand this part, upgrading their internet plan without considering how efficient the radios on their current devices are. Retries are the silent killer of airtime capacity. Every time a transmission fails, it has to be resent. That’s more airtime, and it’s not free. It happens when there is weak signal strength or interference, so system has to try sending the data again, using up more airtime. In a noisy environment (i.e., next to other networks, in the vicinity of microwaves) the retry rate goes way up. An innocent sounding eight percent retry rate translates into almost one tenth of pure overhead on every single transmission.
The calculator takes this into account automaticly. However, knowing why retries matter can help you understand what is going wrong well before it turns into an outage.
Next, there’s the issue of multicast traffic, which tend to be forgotten when people is thinking about their networks. Things like Chromecast discovery, Apple casting, and IoT device announcement packets tend to get sent out to everyone on the network at slowest possible rate (so that all devices will pick them up). That means even though the amount of multicast data being thrown around isn’t very high (in terms of throughput), a little bit of multicast data can gobble up a huge amount of airtime. If you have a half-megabit-per-second multicast workload… Nothing to sneeze at, it could still take up a few percent of your channel just because it goes out that slowly. Trimming down unneeded broadcast traffic is among simplest things you can do to make your network seem faster.
The other element in the network design equation is channel width. Increasing this from 20 to 80 megahertz will increase throughput significantly. You’re able to push more data through with each transmission. But it also makes the channel more prone to interference from nearby channels. A wider channel will pick up noise that a narrower one won’t. In a densely populated setting (e.g., an apartment building), there’s a trade off between raw speed versus reliability. Sometimes you might find better results narrowing down the channel width instead of pursuing higher theoretical speeds if your neighbors are the problem.
Set your use expectations realistically and plan accordingly. If you’re running an entire cell on WiFi then don’t expect it to hit 100% utilization; there’s no headroom for traffic spikes, beacons, management frames etc. A target utilization ceiling of ~70% will result in smooth roaming with low latency. This headroom allows for occasional traffic spikes (someone starting a big download) without grinding the remaining network to a halt. You should of planned for this.
Today’s tools give us a chance to see those unseen limits. They allow us to model the load on the multicast, the rate of retries, and the number of active clients. We can predict bottleneck conditions ahead of time. We move from “buying more expensive gear” mode to “making sure we are using shared resources wisely” mode. Instead of saying “it must be my internet provider,” we say, “I need to tune the environment.”
It isn’t about making everything go as fast as possible. It’s about having a conversation where someone doesn’t interrupt. Your friend can have a video call without it dropping. They get to enjoy their dinner without interruption. That’s what makes a really good wireless network (it balances fairness against speed), so that even if it slows down the fastest device, everyone else plays nice along.