HomeServerBlog SSD endurance planner
DWPD Calculator
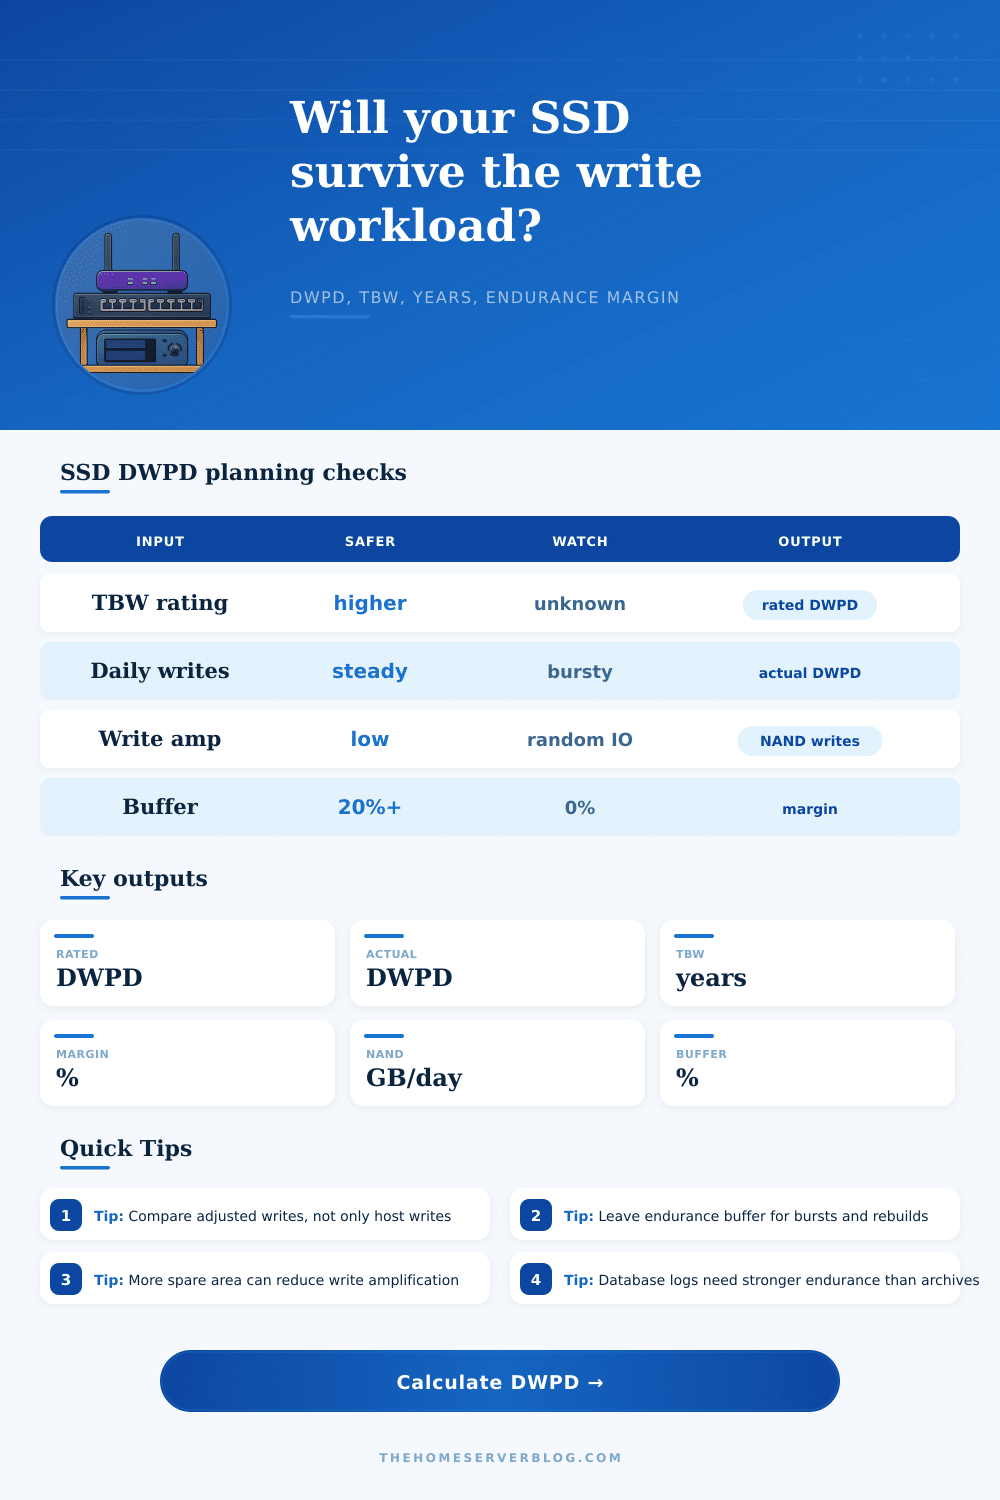
Estimate rated drive writes per day, real workload DWPD, years to the TBW limit, and endurance margin after write amplification, spare area, compression, workload behavior, and a safety buffer.
Light client SSD
0.10-0.30 DWPDFine for OS, apps, containers, and light package caches with modest daily writes.
NAS cache SSD
0.30-1.00 DWPDGood for read cache, metadata, light VM storage, and home lab service pools.
Enterprise mixed use
1-3 DWPDDesigned for VM datastores, database indexes, logging, and active service writes.
Write intensive
3-10+ DWPDBest fit for WAL, queue disks, SLOG devices, ingest buffers, and sustained write loads.
| Preset | Capacity | TBW | Workload | Why it matters |
|---|---|---|---|---|
| Consumer SATA SSD | 2 TB | 1,200 TBW | Mixed NAS services | Typical home server boot, container, and light application write pattern. |
| NAS Cache SSD | 1 TB | 1,000 TBW | VM datastore random mix | Cache devices can quietly absorb more writes than the main pool. |
| Enterprise NVMe | 3.84 TB | 7,000 TBW | VM datastore random mix | Higher TBW and warranty DWPD make dense virtualization less stressful. |
| Proxmox VM Store | 2 TB | 3,600 TBW | VM datastore random mix | Small random writes, snapshots, guests, and swap can raise effective wear. |
| Database WAL SSD | 1.6 TB | 8,760 TBW | Database WAL and indexes | Commit logs reward power-loss protection and high write endurance. |
| CCTV Recording SSD | 4 TB | 2,400 TBW | CCTV rolling recording | Sequential overwrite is friendlier than random writes but volume is constant. |
| ZFS SLOG Device | 0.8 TB | 8,000 TBW | ZFS SLOG sync writes | Sync write devices need endurance, low latency, and power-loss protection. |
| Laptop Lab SSD | 1 TB | 600 TBW | Desktop and package cache | Light lab writes usually fit consumer endurance if VMs are not abusive. |
| Write-Heavy Queue Disk | 1.92 TB | 17,500 TBW | Queue, broker, or spool disk | Message queues and spool disks can turn small writes into heavy NAND wear. |
| Step | Formula | Meaning | Output used |
|---|---|---|---|
| Rated DWPD | TBW / (capacity TB x 365 x warranty years) | Manufacturer endurance expressed as full-drive writes per day. | DWPD rating card |
| Compressed host writes | daily GB x (1 - compression %) | Logical data that remains after compression or dedupe-like savings. | Host writes label |
| Effective write amp | base WA x workload factor x spare factor | Randomness increases write pressure; spare area reduces it. | Write amp label |
| Actual DWPD | adjusted NAND GB / (capacity TB x 1000) | How many full-drive writes the workload consumes each day. | Actual DWPD card |
| Years to TBW | protected TBW / annual adjusted TB | Runway after buffer and modest spare-area endurance credit. | Years to TBW card |
| Margin | (safe daily budget - adjusted NAND GB) / safe budget | Remaining daily budget after the configured buffer. | Endurance margin card |
| Workload type | Factor | Typical source | Endurance note |
|---|---|---|---|
| Desktop and package cache | 0.75x | OS updates, app installs, logs | Usually bursty and light, but browser caches can be noisy. |
| Sequential media/archive | 0.85x | Backups, media ingest, file copies | Sequential writes are friendlier to flash translation layers. |
| Mixed NAS services | 1.00x | Containers, SMB, metadata, logs | Good default for a balanced home server. |
| VM datastore random mix | 1.35x | VM disks, snapshots, swap | Many small random writes raise flash housekeeping. |
| Database WAL and indexes | 1.50x | Postgres, MySQL, SQLite, indexes | Write rate, fsync, and small updates make endurance planning important. |
| CCTV rolling recording | 0.90x | NVR continuous video writes | High volume but mostly sequential overwrite behavior. |
| ZFS SLOG sync writes | 1.80x | NFS sync, databases, VM sync writes | Choose power-loss protected, high-endurance SSDs. |
| Queue, broker, or spool disk | 1.60x | Kafka, mail queue, CI artifacts | Small append and delete cycles can consume TBW quickly. |
| Finding | Check | Practical action | Priority |
|---|---|---|---|
| Negative margin | Actual DWPD exceeds safe budget | Move to higher TBW media, split writes across mirrors, or reduce retention churn. | High |
| Short TBW runway | Years to TBW below warranty | Use an enterprise SSD or reduce write amplification before production use. | High |
| High write amplification | Effective WA above 2.0x | Add spare area, align datasets, tune record size, or reduce random write pressure. | Medium |
| No buffer | Endurance buffer below 10% | Reserve 15-30% for spikes, rebuilds, migrations, and vendor rating uncertainty. | Medium |
| Heavy sync writes | SLOG, WAL, or queue preset | Prioritize power-loss protection and sustained write endurance over peak benchmark speed. | Medium |
This calculator estimates endurance from TBW-style ratings and workload assumptions. It does not replace vendor qualification, SMART wear monitoring, power-loss protection requirements, thermal checks, firmware advisories, backups, or restore testing.
Solid-state drives exist for one reason: Speed. You pop them in your server, fill ’em up with database logs or virtual machines and expect them to keep working as long as there’s juice on the motherboard. That assumption is how people lose data; not because of a dead battery, but because flash memory degrades over time. Why? Because flash memory have an expiration date. Specifically, it has a terabyte written (TBW) limit. That’s how much data you can write to the drive’s cells before those cell start degrading.
But that figure doesn’t always paint full picture. It’s akin to learning that your fuel tank has 50 gallons but not being sure whether you’re powering a dump truck or a Prius. But what matters most is how quickly you deplete that rated capacity. I.e., how fast do you drain your allowance? That’s where DWPD, or drive writes per day, comes into play: It’s the unit of currency that truly reflects endurance.
Why SSDs Wear Out Fast
Plug your workload details into the calculator above and it does the math for you. You don’t have to guess whether your random I/O patterns will consume double the number of NAND cycles compared to your sequential backup jobs. Most users pay attention to host writes: the data points traversing your SATA or USB cable. But the drive doesn’t care about those; it cares about physical NAND writes. Because of write amplification, those numbers tend to be nearly always higher. That’s the block-management and garbage-collection overhead.
For example, if you’re running a small random workload with lots of small writes (e.g., ZFS sync device, transaction log for MySQL/PostgreSQL), then it’s going to dominate the I/O pattern, which forces the controller to shuffle other stuff around so there’s space for new stuff. This inflates physical wear well beyond logical input. A write amplification factor of only 1.5x means your drive will wear out 50% faster than the rate at which files is transferred to and from it. And that’s where people mess up: they look at this high TBW rating and think “safe!” without realizing how their actual I/O pattern amplifies the damage.
The equation changes completely when there is spare area. When you leave some unallocated free space on the drive, that creates room for the controller to breathe. It can consolidate fragmented data better and swap out bad blocks more efficiently. That reduces the amplification factor naturaly. By doing so it adjusts effective wear based off how much headroom you have. To buy longevity physically, you’re effectively paying for capacity you may never use logically.
Then there’s compression. That’s another unexpected factor. Hardware-assisted compression saves space by shrinking the amount of data actualy written to those cells. Most new drives has some form of this and it gives you free endurance. But for certain workloads, like deduplicated archives and encrypted volumes, the data don’t shrink. It resists. And that can be the difference between a healthy drive and a failing one.
It is not about peak read speed or even the sticker price. DWPD ratings are frequently promoted on enterprise drives. Those drives has tougher layers of NAND, or they use more over-provisioning by default. You may see a rating of 0.3 DWPD on a consumer SATA drive. In other words, that drive will survive rewriting thirty percent of its capacity every day. That doesn’t sound like much until you consider how few home server write more than that, especially if they’re not doing something wrong. For most of your home lab workloads, you’ll fall within the 0.1 to 0.3 range with room to spare.
Things get dangerous when virtualization snapshots and swap files creates a constant churn. Your actual writes exceeds what’s rated on the drive, but all this happens silently. Look at the endurance margin output; that will tell you where you stand. Anything above 0% is good (you’ve got some room left for data migrations/firmware updates/spikes in usage). Anything below is bad because you are exceeding warranty assumptions, and this usually happens right before things fail quickly.
Don’t wait until SMART warns you. Once error correction begins chugging, flash degradation accelerate quickly. The final ten percent of life tends to collapse rapidly. Endurance planning isn’t about spending big bucks on fancy gear, but rather understanding how this medium work. Try to minimize random writes and leave some empty space. Run that tool and see if what you’re running stays well inside warranty limits.
You should of tried minimizing them earlier. You aren’t trying to get the last bit of TBW out of each and every gigabyte. You are trying to make sure it lasts longer than its intended use so there is no concern at all.