5G Link Budget Calculator
Estimate received power, free-space path loss, fade margin, uplink margin, and practical cell radius for FR1, CBRS, private 5G, FWA, and mmWave planning.
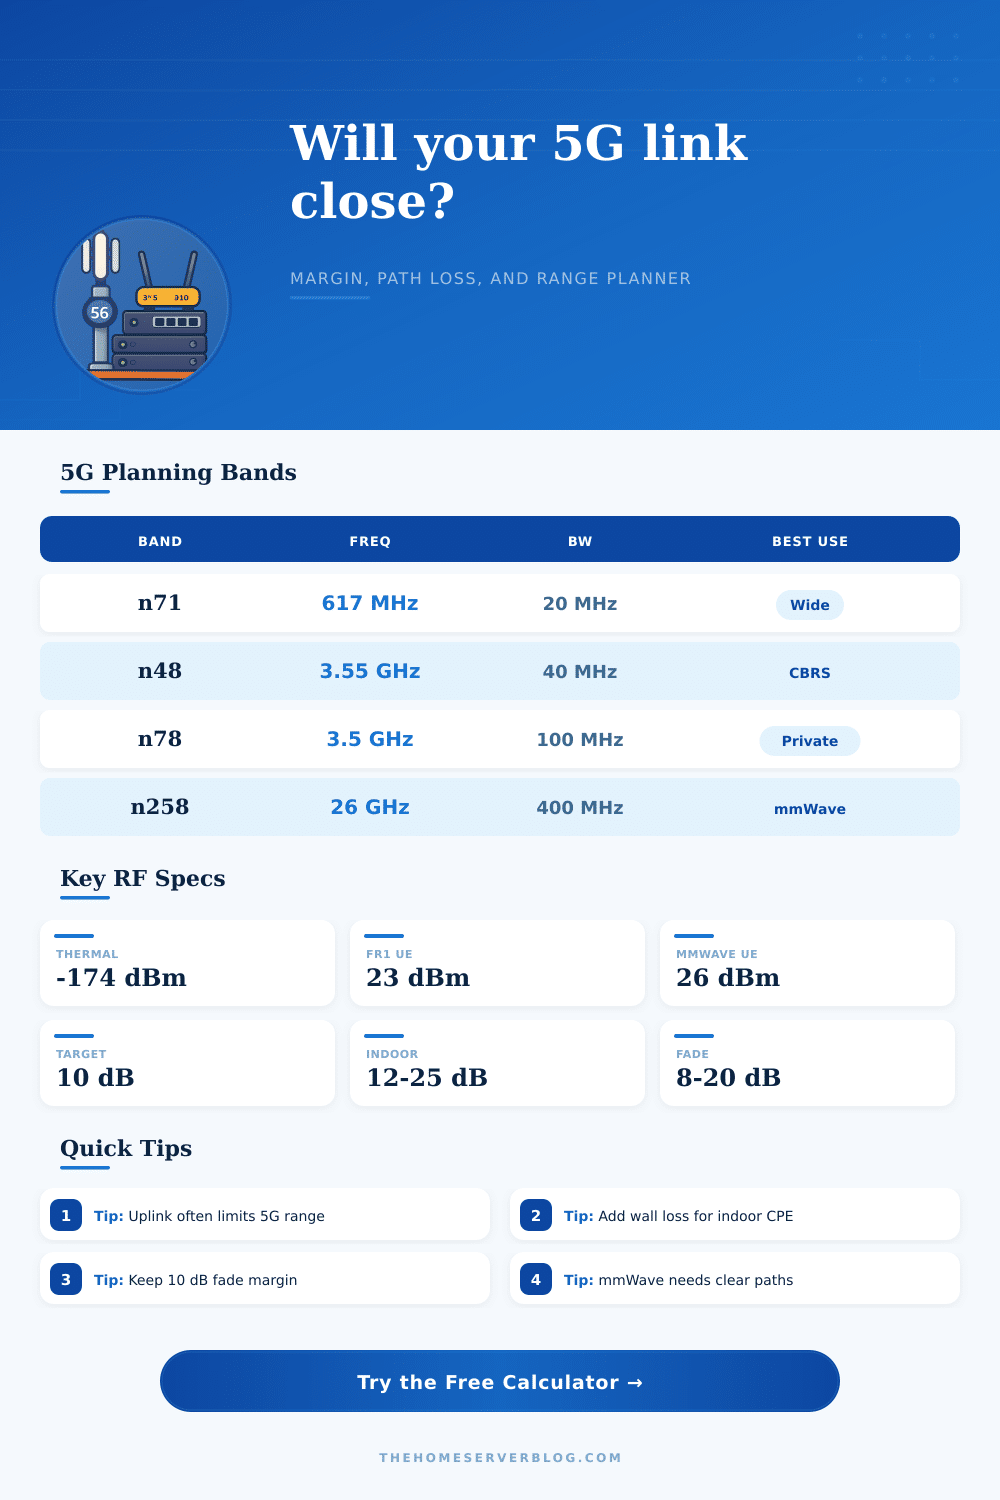
| NR Band | Typical Frequency | Planning Bandwidth | Link Budget Note |
|---|---|---|---|
| n71 low band | 617 to 698 MHz | 5 to 20 MHz | Best building reach and rural coverage, lower capacity per sector. |
| n41 mid band | 2.5 GHz range | 40 to 100 MHz | Strong capacity with moderate path loss; popular for outdoor macro layers. |
| n48 CBRS | 3550 to 3700 MHz | 10 to 40 MHz | Common private 5G and neutral-host range with shared-spectrum constraints. |
| n77 / n78 C-band | 3.3 to 4.2 GHz | 60 to 100 MHz | Private campus and public 5G sweet spot; uplink should be checked carefully. |
| n79 high mid band | 4.4 to 5.0 GHz | 40 to 100 MHz | Higher path loss than C-band; useful for lab and dense campus designs. |
| n258 / n261 mmWave | 24.25 to 29.5 GHz | 100 to 400 MHz | Very high capacity but needs beamforming, short range, and limited obstruction loss. |
| Calculation | Formula Used | Unit | Why It Matters |
|---|---|---|---|
| Free-space path loss | 32.44 + 20 log10(MHz) + 20 log10(km) | dB | Baseline RF spreading loss before clutter, walls, body loss, and reserve. |
| Thermal noise | -174 + 10 log10(bandwidth Hz) | dBm | Wider 5G channels raise noise power and require more received signal. |
| Receiver sensitivity | Noise + NF + SINR + implementation allowance | dBm | Minimum received power needed for the selected service target. |
| Downlink margin | DL EIRP + UE gain - FSPL - losses - sensitivity | dB | Checks gNB-to-device coverage and indoor or FWA receive quality. |
| Uplink margin | UE EIRP + gNB gain - FSPL - losses - sensitivity | dB | Often the limiting path because phones and small endpoints transmit less power. |
| Maximum radius | 10 ^ ((allowed loss - 32.44 - 20 log10(MHz)) / 20) | km | Estimates range at the requested fade margin using the limiting direction. |
| Environment | Typical Extra Loss | Best 5G Fit | Planning Caution |
|---|---|---|---|
| Outdoor clear line of sight | 0 to 6 dB | FWA, campus, test ranges | Use terrain and antenna height checks for longer hops. |
| Suburban trees and rooftops | 8 to 18 dB | Mid-band neighborhood sectors | Seasonal foliage can remove several dB of margin. |
| Urban street canyon | 15 to 30 dB | Dense small cells and C-band | Reflections may help coverage but can make field results uneven. |
| Indoor office or home lab | 12 to 25 dB | Private 5G, lab gNB, neutral host | Walls, low-E glass, and equipment racks dominate the budget. |
| Warehouse aisles | 10 to 24 dB | CBRS private 5G and scanners | Metal racks create aisle-by-aisle shadowing and fast fades. |
| Dense venue hotspot | 18 to 35 dB | mmWave, n77, small sectors | Human body loss and interference allowance matter more than raw path distance. |
| Equipment Class | Typical EIRP | Receiver Trait | Useful Design Check |
|---|---|---|---|
| Indoor private gNB | 24 to 37 dBm | Moderate NF, modest antennas | Model wall loss before assuming whole-floor coverage. |
| Outdoor CBRS small cell | 37 to 47 dBm | Sector antennas, limited bandwidth | Check SAS limits and uplink margin for phones. |
| Massive MIMO AAU | 55 to 64 dBm | High array gain and beamforming | Downlink may look excellent while uplink remains constrained. |
| FWA rooftop CPE | 23 to 30 dBm UE side | Directional CPE gain helps receive | Window and roof edge loss can decide installation quality. |
| mmWave panel | 48 to 65 dBm | Narrow beams, high bandwidth | Blockage and rain margin should be treated as primary losses. |
| RedCap endpoint | 14 to 23 dBm UE side | Low power and simple antennas | Use uplink priority because device power is the coverage limiter. |
When you are planning a 5G networks, you must determine whether the 5G signal will reach the devices that you intend for the network to serving. There are many different factor that can lead to the 5G signal failing to reach the devices that you are planning to serve. These factors include the frequency of the 5G signal, the height of an antenna that will emit the signal, the materials that are used to construct buildings, and the power of the devices themselves.
If you dont account for these factors, your network may experience a loss of signal to the devices, leading to dropped calls or other stalled data transmissions from those devices. Path loss is caused by the fact that the radio energy from the base station spread out over distance as the signal travels to the device. Signals of higher frequencies experience more path loss then signals of lower frequencies.
Things to Check When Planning a 5G Network
For instance, a 3.5 GHz 5G carrier will experience more path loss over a given distance than a 700 MHz carrier, and a 26 GHz 5G carrier will experience significantly more path loss than a 3.5 GHz carrier. The more physical objects the signal must travel through, such as walls, trees, metal shelving, or glass, the more path loss the signal experiences. Path loss contributes to the total signal loss between the base station and the device.
Uplink power is a factor to consider when planning a 5G network because the power of the base station is much higher than the power of the device. Base stations can have uplink powers of 37 dBm or higher, but phones and sensors may only has uplink powers of 23 dBm. Thus, the uplink power of the device is likely to fail before the downlink power fails.
For networks that deploy devices in areas such as warehouses, you should consider the uplink power when building the network. The uplink power will determine the maximum range that the signal can travel. If the uplink power is not consider, the network may find that the device can receive signals from the base station, but the device cannot send signals to the base station.
In addition to the factors discussed above, the environment settings for the network will impact the signal that is transmitted from the base station to the device. An outdoor location with clear line-of-sight to the device will experience significantly less signal loss than a dense urban area or crowded venue where the signal must travel through more obstacle. A 15 dB environmental loss can reduce the range of signals by half, and you must consider this value in the network planning phase.
Environmental factors such as foliage, elevator cores, and low emissivity glass can also reduce the strength of the signal that is transmitted to the device. Another factor that should be considered is the fade margin. This factor allow for additional loss due to environmental changes.
A fade margin of 10 dB is typically targeted for 5G networks. An increased fade margin of 15 or 20 dB will increase the reliability of the network, but will also decrease the range of the network. If the fade margin is decreased to 6 dB, the range of the network will be increased, but a 6 dB fade margin will not allow for enough margin to account for changes in the environment.
The choice of bandwidth for the 5G signal will impact the data that is transmitted between the devices. Higher bandwidths can allow a network to transmit more data over a given period, but they also increases the noise floor of the system. A 400 MHz mmWave carrier will allow devices to reach high data rates, but the 400 MHz carrier will also require a clear, short path from the device to the base station in order to maintain a high Signal-to-Interference-plus-Noise Ratio (SINR).
The thermal noise in the system will change if the bandwidth of the system change, thus you will have to recalculate the model to account for the change in bandwidth. One of the more difficult factors to account for in the planning of the network is antenna gain and beamforming. Antenna gain is only effective if the antenna beam is pointed direct at the device.
In an indoor or mobile environment, the antenna gain decreases rapidly due to movement of the device or misalignment of the antenna beam. A calculator can be used to introduce losses in these antenna to account for the reduction of antenna gain, or to increase the loss in the cables connected to the antenna. In addition to the factors discussed above, there are additional challenges in the planning of private 5G networks and CBRS spectra.
Because the private 5G bands are shared with other networks, the other networks sharing the same band of spectra can limit the signal power of the 5G network. In addition, interference between these networks will reduce the signal margin of the private 5G network. Thus, the extra 3 dB of implementation allowance will significantly reduce the size of the cell in the private 5G network.
The output of the 5G network calculator will indicate the maximum radius of the 5G signal from the base station. This value is calculated after accounting for the loss of signal due to the factors discussed in this paper. If the calculated maximum radius is too short to serve the number of devices that the 5G network is to serve, then the antenna height can be increased, the clutter loss can be reduced, or repeaters can be added to the network.
Additionally, you can lower the target SINR, which will increase the maximum radius of the signal. However, lowering the target SINR will decrease the quality of the connection between each device and the network. The three most important factors to consider in the planning of a 5G network are the frequency of the 5G signal, the uplink power of the devices, and the environment in which the network will be deployed.
After these factors have been established, the other factors become less important variables to consider. A 5G network calculator can be used to test the assumption that you make about your network. The variables that have been discussed can be entered into the calculator to determine if the variables will result in a possible network failure.
In addition to using the network calculator, the results of the network can be tested on the actual site where the network will be deployed.