Erlang C Calculator
Estimate staffing, wait probability, service level, occupancy, and queue pressure for support desks, MSP queues, NOC shifts, and home lab service operations.
Find Staffing increases agent count until both service level and occupancy targets are met. Audit Scheduled keeps your entered staffing fixed.
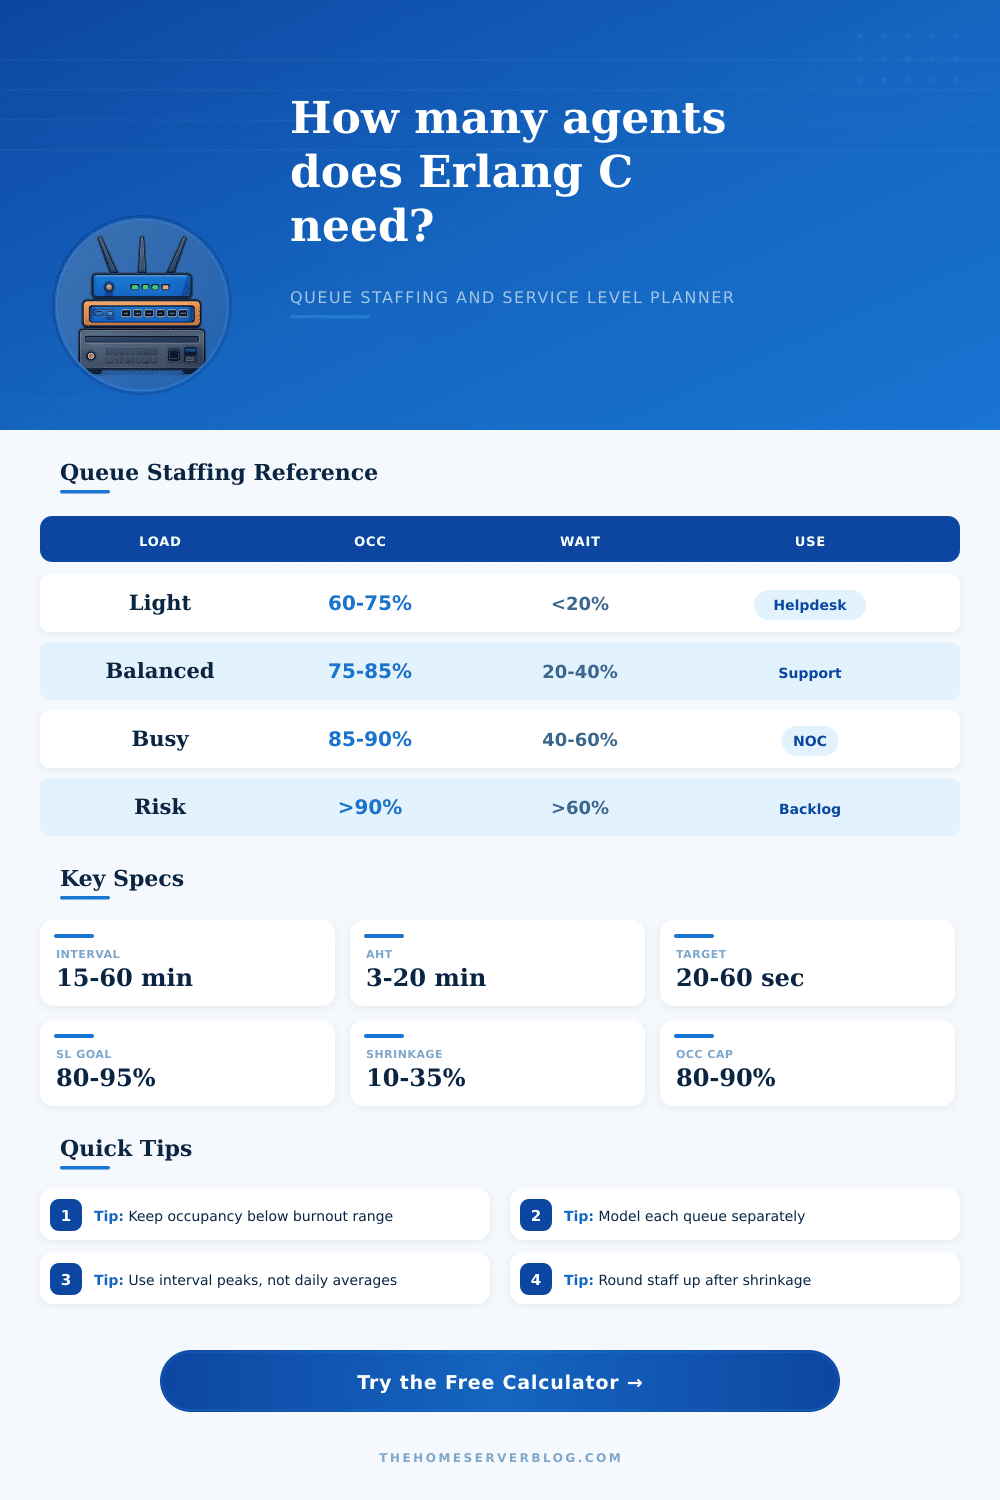
| Occupancy Range | Queue Meaning | Planning Signal | Typical Use |
|---|---|---|---|
| 60% to 75% | Light load with recovery room | Useful for training or volatile arrivals | Small home lab desk |
| 75% to 85% | Balanced utilization | Good target for steady support queues | Helpdesk or MSP triage |
| 85% to 90% | Tight but workable | Watch burnout, backlog, and SLA misses | NOC peaks or bridge support |
| Above 90% | Little slack for random arrivals | Add staff, lower AHT, or deflect demand | Outage spike only |
| Term | Formula Role | Units | Practical Note |
|---|---|---|---|
| Traffic intensity A | Contacts x AHT / interval | Erlangs | Represents continuous workload demand |
| Agent count N | Parallel servers in queue model | Agents | Must be greater than A for stability |
| Probability wait Pw | Erlang C delay probability | Percent | Chance an arrival waits before answer |
| Service level SL | 1 - Pw x exp(-(N-A)t/AHT) | Percent | Chance answer occurs within target |
| ASA | Pw x AHT / (N - A) | Seconds | Average wait across all arrivals |
| Occupancy | A / N | Percent | Higher means less idle recovery time |
| Profile | Typical AHT | Target Answer | Common Occupancy Cap |
|---|---|---|---|
| Helpdesk phone intake | 5 to 8 minutes | 20 to 30 seconds | 80% to 85% |
| NOC alert queue | 4 to 10 minutes | 15 to 30 seconds | 75% to 85% |
| MSP client triage | 6 to 12 minutes | 30 to 60 seconds | 80% to 88% |
| Incident bridge desk | 10 to 20 minutes | 15 to 30 seconds | 70% to 80% |
| Field dispatch queue | 4 to 7 minutes | 30 to 60 seconds | 80% to 90% |
| Event support command | 3 to 6 minutes | 10 to 20 seconds | 70% to 85% |
| Scenario | Arrivals / Interval | AHT | Planning Focus |
|---|---|---|---|
| Home lab weekend support | 12 per 60 minutes | 8 minutes | Keep wait risk visible |
| MSP morning rush | 55 per 30 minutes | 7 minutes | Staff to 80/30 or better |
| NOC alert storm | 75 per 30 minutes | 5 minutes | Protect occupancy headroom |
| SaaS support pod | 95 per 60 minutes | 9 minutes | Compare scheduled vs required |
| Incident bridge intake | 30 per 15 minutes | 12 minutes | Avoid unstable queue load |
Queue management is an system that is used to handle incoming calls. Call management systems requires a certin number of staff member to handle those calls in such a way that the wait time for those calls are low. Many call managers feel that the number of staff members that are required to handle the average number of calls that will come into the system will be sufficient.
However, staffing according to the average number of calls are not sufficient for call management systems due to the fact that calls is randomly distributed into the system. As a result of calls being randomly distributed into the system, calls often arrive in clump. These clumps of incoming calls often create a backlog of calls for the staff members to answer.
How to manage call queues and staff in a call center
The staff members cannot answer the backlog of incoming calls result in an increase in the wait times for callers. The Erlang C model is a model that is used to determine the number of staff members that is required to keep a queue in a call management system stable. The Erlang C model accounts for the fact that calls are randomly distributed into a call management system.
One of the factors that is used in the Erlang C model is the average handle time. The average handle time for calls is the amount of time that it takes for an agent to handle a single call. The average handle time are important in determining the number of staff members that is required for a call center because changing the average handle time will impact the number of staff members that is required to handle the calls.
For instance, if the average handle time for calls increases thirty seconds for each call agent answer, the call center will need to increase the number of staff members to handle the calls. The Erlang C model can be used to determine how changing the average handle time will impact the number of staff members required for a call center. The model suggest that increasing the efficiency with which calls are answered may be more effective than increasing the number of staff members.
Another factor in call management is occupancy rates. Occupancy rates are a measure of the percentage of time that the call agents is on the phone taking calls (occupancy) versus the percentage of time that they is not on the phone (idle). Many call management systems believe that high rates of occupancy are a sign of an efficient call center.
High rates of occupancy, however, pose a potential problem for call management because high rates of occupancy mean that there is no time for the agents to rest between calls. If the agents is occupied with taking calls, they will have no breathing room in the case that calls arrive in clumps. As a result of these clumps of calls, there will be long wait times for callers.
A balanced queue will have a certain rate of occupancy to allow for the agents to have time to rest between calls. Another factor that must be accounted for in staffing a call center is the concept of shrinkage. Shrinkage refer to the amount of time that the call center pays the staff members but they are not available to answer calls.
For example, staff members may get sick, they may be required to attend meeting, or they may be taking lunch breaks. Staffing the call center with the number of staff members that is required to handle all calls will not provide enough staff members because of shrinkage. For example, if the call center requires ten agents to handle all incoming calls, twenty percent of shrinkage will occur.
In this case, the number of staff members that will be scheduled is more than ten to account for staff members who may be absent due to shrinkage. The service level for a call center is the goal that the call center establishes for the number of calls that is answered within a specific timeframe. The service level is expressed as a percentage.
One example of a service level goal is the eighty-twenty rule which state that eighty percent of calls will be answered within twenty seconds of an incoming call. Increasing the service level goal to a higher percentage will require an increased number of staff members to answer calls. For example, increasing the goal from eighty percent to ninety-five percent will require an exponential increase in the number of staff members to answer calls.
In this case, managers will have to decide if the increase in the satisfaction of customers is worth the increase in the payroll cost of the call center. Planning for the peak interval for calls will be more effective than planning for the average number of calls that will come into the system each day. Planning for the peak interval will allow call management systems to avoid the increase in wait times for callers that result from calls being distributed in clumps during the peak interval.
An increase in occupancy rates for agents indicates that there is a risk that calls will arrive in clumps during that period. High levels of occupancy mean that agents will not have time to rest between calls. Staffing is a balance between the cost of the staff members for the call center and the frustration of callers who has to wait for long periods of time until their calls are answered.
By using the Erlang C model, call centers can treat the queuing process as a system of probability. In this way, the management can make the management of calls that were once an unpredictable process into a predictable mathematical problem.