WiFi Throughput Calculator
Estimate usable wireless speed after PHY rate, channel width, signal quality, airtime sharing, interference, and wired backhaul limits.
Estimated Wi-Fi Capacity
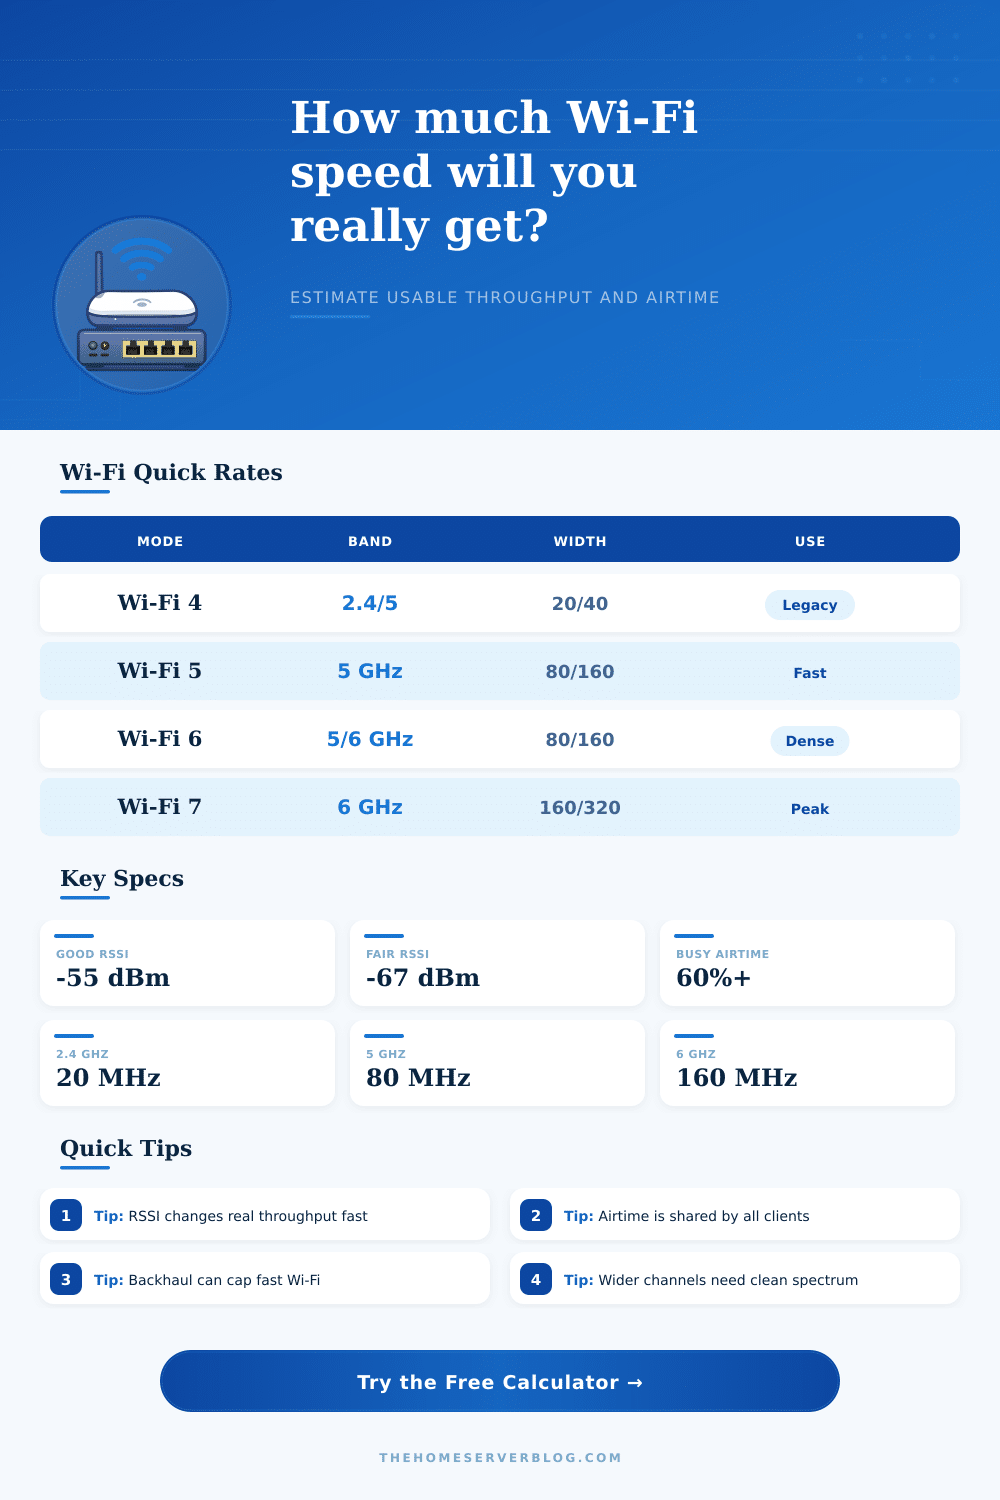
| Standard | Best Band | Common Width | Approx 2-Stream PHY | Practical Use |
|---|---|---|---|---|
| Wi-Fi 4 / 802.11n | 2.4 or 5 GHz | 20 or 40 MHz | 144 to 300 Mbps | Legacy devices, low-density rooms, IoT isolation |
| Wi-Fi 5 / 802.11ac | 5 GHz | 80 MHz | 867 Mbps | Older laptops, streaming clients, general home use |
| Wi-Fi 6 / 802.11ax | 5 or 6 GHz | 80 or 160 MHz | 1201 to 2402 Mbps | Dense homes, OFDMA-capable clients, modern phones |
| Wi-Fi 7 / 802.11be | 6 GHz | 160 or 320 MHz | 2882 to 5764 Mbps | Short-range high speed clients and fast LAN transfers |
| Setup | Expected Limit | Typical Clients | Watch First | Best Upgrade |
|---|---|---|---|---|
| Single 5 GHz AP, 80 MHz | 450 to 750 Mbps usable | 5 to 25 | RSSI below -67 dBm | Better AP placement |
| Same-channel mesh hop | 40% to 55% of link | 3 to 12 | Relay airtime penalty | Wired backhaul |
| 6 GHz 160 MHz room AP | 1.1 to 1.8 Gbps usable | 2 to 12 | Wall loss and backhaul | 2.5G Ethernet uplink |
| 2.4 GHz IoT network | 35 to 120 Mbps usable | 15 to 60 | Airtime from slow clients | 20 MHz channels |
| Metric | Good | Usable | Risk Zone | Why It Matters |
|---|---|---|---|---|
| RSSI | -45 to -60 dBm | -61 to -67 dBm | Below -70 dBm | Drives modulation rate and retries |
| SNR | 30 dB or more | 20 to 29 dB | Under 20 dB | Higher SNR supports higher MCS rates |
| Channel use | Under 30% | 30% to 60% | Over 60% | Wi-Fi is half-duplex shared airtime |
| Ethernet uplink | 2.5G or faster | 1G for most homes | 100M uplink | Backhaul caps fast wireless PHY rates |
| Project | Target Speed | Latency Need | Recommended Link | Capacity Note |
|---|---|---|---|---|
| 4K streaming room | 25 to 100 Mbps | Medium | 5 GHz Wi-Fi 5 or better | Stable RSSI matters more than peak PHY |
| Game console | 20 to 150 Mbps | High | 5 GHz, low channel use | Keep airtime under 50% during play |
| NAS laptop copy | 600 Mbps to 1.5 Gbps | Low | Wi-Fi 6/7 near AP | Use 2.5G AP uplink for gigabit-plus |
| IoT and cameras | 2 to 12 Mbps each | Medium | 2.4 GHz or wired cameras | Slow clients can consume extra airtime |
The speed that is listed on the router box may not be the speed that you experience from your router. This is because the speed listed on the router box is the theoretical maximum speed that the router can provide. The theoretical maximum speed assume that there are no issues with signal quality or interferance.
Without an unlimited number of device being able to connect to the network and share the communication channel with the router, it is impossible for a device to reach the theoretical maximum speed. Thus, the actual speed that users experience will always be lower than the theoretical maximum speed listed on the router box. Wi-Fi dont provide the constant flow of data to all devices connected to the network.
Why Your Wi‑Fi Is Slower Than the Router Box Says
Instead, Wi-Fi devices must take turns communicating with the router. The data transfer rate of a router is the maximum amount of data that can travel in one second, but this rate is the PHY rate. This PHY rate is not the same as the speed at which users experience data traveling.
Devices lose some of the data transfer rate to protocol overhead and must wait for a chance to communicate with the router. Using a calculator that compute data transfer loss allow a user to convert the theoretical maximum data transfer rate into a usable data transfer rate for establishing a lab or media center. Signal strength are another important factor in determining the data transfer rate of a Wi-Fi network.
Signal strength, or the quality of the signal, is represented in terms of RSSI, which is a measurement in negative decibels. A higher number of negative decibels represent a weaker signal. Therefore, a signal with a strength of negative eighty decibels is weaker then a signal of negative sixty decibels.
When signal strength drop, Wi-Fi devices agree to use a slower method of encoding data so that the data can be transmitted. Signal strength can be affected by many factor. For instance, if a person moves even a short distance from the router or place a wall between themselves and the router, their signal strength could decrease.
Any decrease in signal strength will result in a drop in data throughput. Another factor that can impact the data transfer rate of Wi-Fi is airtime. Airtime for a Wi-Fi network are limited because Wi-Fi uses a half-duplex system to communicate.
With a half-duplex system, only one device can communicate with the router at any given time. For people who owns many devices, all of those devices must share the available airtime on the network. Older devices have slower data transfer speeds than newer devices.
These slower devices take up airtime when communicating to the router, thus slowing down the data transfer speeds of devices with more higher data transfer speeds. One older device in a network of moddern device can slow down the modern Wi-Fi 6 network. A third factor that can contribute to the data transfer rate of a network is the bandwidth of the Wi-Fi signal.
The bandwidth, or the width of the signal, is a balancing act. High bandwidth, such as 160 MHz, allow for more data to pass through the network at any given time. However, high bandwidth also makes the network more susceptible to interferance from other networks sharing the same bandwidth.
In other cases, a narrower bandwidth create a more stable network with higher data transfer speeds. The backhaul for a wireless network is the Ethernet cable that connect the wireless access point to the router wall. The wireless link may offer very high data transfer speeds, but if the Ethernet cable connecting the wireless access point to the router is limited to only one gigabit per second, then the Ethernet cable will limit the data transfer speed.
Any bottleneck created by the Ethernet cable will limit the wireless networks data speed. While people may upgrade their router to a higher speed, they often forget to upgrade their Ethernet cables. Another feature provide by the calculation tool is the per-client estimate of the network.
The per-client estimate calculates the amount of data transfer speed available to each client device when all the clients are using the network at once. If a household have many devices, the per-client estimate will calculate the amount of data transfer speed each device receive when all the devices are streaming data simultaneously. If the amount of per-client data transfer speed is too low for 4K movies or online gaming, then the network has a capacity problem.
By understanding these variables, a person can determine if their data link issues are the result of a physical wall, channel congestion, or an outdated Ethernet cable.