WiFi Signal Strength Calculator
Estimate received signal strength, usable range, link margin, and practical Wi-Fi quality from access point power, band, distance, walls, floors, and client requirements.
Link Budget Breakdown
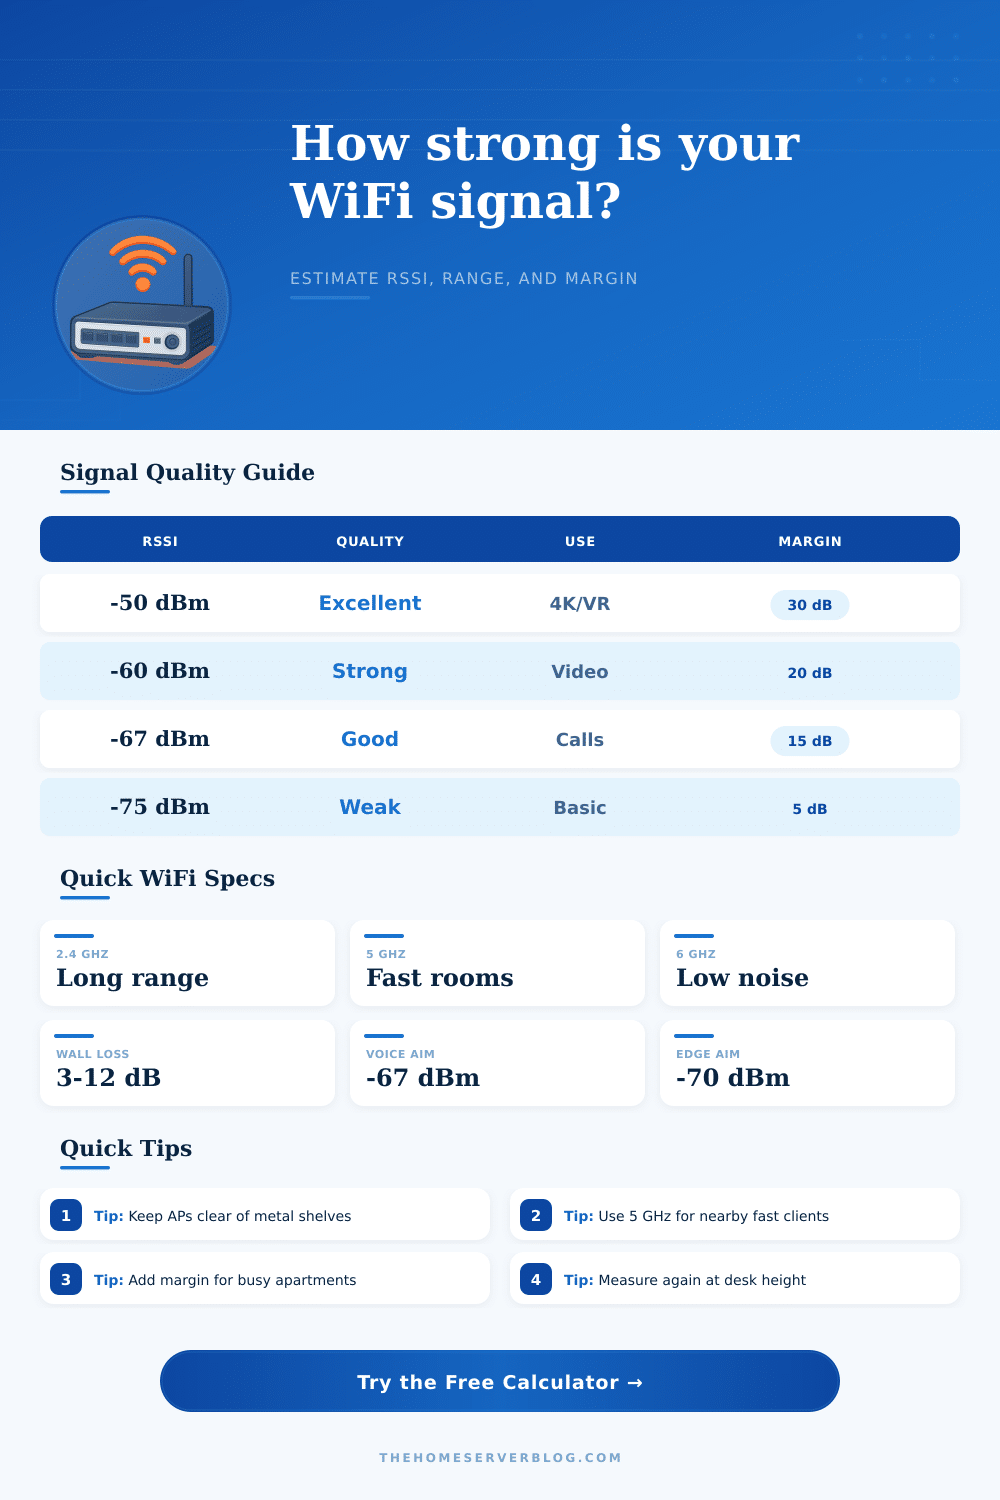
| RSSI Range | Quality | Best Fit | Planning Note |
|---|---|---|---|
| -30 to -50 dBm | Excellent | High throughput, low latency | Usually same room or clear line of sight |
| -51 to -60 dBm | Very strong | 4K streaming, gaming, file transfers | Good target for primary work areas |
| -61 to -67 dBm | Good | Video calls and everyday devices | Common voice and roaming planning target |
| -68 to -75 dBm | Usable edge | Browsing, IoT, background sync | Throughput and roaming may feel uneven |
| Below -76 dBm | Weak | Low-data devices only | Add AP density or reduce obstacles |
| Band | Typical Center | Strength | Practical Limit |
|---|---|---|---|
| 2.4 GHz | 2412-2462 MHz | Best wall penetration | More interference, fewer clean channels |
| 5 GHz | 5180-5805 MHz | Balanced speed and range | Higher wall loss than 2.4 GHz |
| 6 GHz | 5955-7115 MHz | Clean spectrum, high speed | Shortest indoor range through walls |
| 20 MHz | Narrow channel | Best noise tolerance | Lower peak throughput |
| 80/160 MHz | Wide channel | Higher peak PHY rates | Needs stronger SNR and cleaner air |
| Material | 2.4 GHz Loss | 5 GHz Loss | 6 GHz Loss |
|---|---|---|---|
| Drywall interior wall | 3 dB | 4 dB | 5 dB |
| Brick, tile, masonry | 8 dB | 10 dB | 12 dB |
| Wood floor / ceiling | 7 dB | 10 dB | 12 dB |
| Low-E glass or metal | 12 dB | 18 dB | 20 dB |
| Project Scenario | Client Count | RSSI Target | Margin Target |
|---|---|---|---|
| Home lab desk and NAS | 3-8 | -60 dBm | 20 dB |
| Family video calls | 5-15 | -67 dBm | 15 dB |
| Smart home sensors | 20-60 | -75 dBm | 8 dB |
| Mesh wireless backhaul | 1-3 nodes | -60 dBm | 20 dB |
| Garage or detached room | 1-6 | -70 dBm | 10 dB |
Wireless signal strength and wireless data speed is two different concepts. Many people believe that the higher the signal bar indicating the strength of the wireless signal, the more higher the data speed. However, the number of signal bars only indicate the power of the signal.
The RSSI (radio signal strength indicator) represent the power of a signal. This measurement is of the signal power, not the data speed of the signal. A signal strength calculator create a map of the energy loss of the radio waves as they moves from the router to the device.
Signal strength is not the same as data speed
Several physical objects in the home can cause the loss of the signal strength of the radio waves. These physical objects can be more significant than the distance between the router and the device. For example, a sheet of drywall can cause a small loss of signal strength, but a brick fireplace or mirrored closet can cause significant loss of signal.
The materials of the objects in the house can dictate the data signal strength of the wireless signal. The 2.4 GHz frequency band can travel the more great distance, but it have the lowest data speeds. The 5 GHz band can deliver higher data speeds than the 2.4 GHz band but has a shorter range due to the signal’s struggle in penetrating solid objects.
The 6 GHz band can deliver the highest data speeds but struggle the most with solid objects, like heavy doors or thick walls. Therefore, you must choose between the importance of high data speeds or the signal strength required for the signal to travel through the home. When using a network planning tool, you should focus on the link margin.
The link margin are a number that represents the amount of extra signal strength the wireless signal will have before the connection become unstable. A high link margin will maintain the wireless connection even when the environment change. A low link margin may result in dropped connections due to movement of individuals in the house, doors closing, or the presence of other electronic device emitting radio frequencies.
The noise floor represent the level of background noise and radio frequency interference in an area. High levels of noise can make it difficult for the wireless device to effective receive the signal. In areas with many wireless signals emanating from smart devices and other electronics in apartment complexes, the noise floor can be high.
This can cause even strong signals to appear slow in data speeds due to the high noise floor. Another consideration when planning your network is where your high-demand devices are in the house. A smart plug will work with a lower RSSI value because it will emit less data.
A gaming computer or a device using a 4K streaming service will require a higher RSSI value. There are different methods to improve the wireless signal in your home by making changes to the placement of the router. Avoid placing the router in a cabinet or near a metal shelf.
These physical objects will interfere with the signal. Moving the router to a higher elevation and ensuring it is free of physical obstructions will improve the wireless data speed. Thus, with an understanding of how to place the router in the home, the wireless signal will remain stable and strong.