Server IOPS Calculator
Estimate mixed storage IOPS, read and write capacity, RAID write penalty, queue-depth pressure, latency headroom, and block-size bandwidth for VM hosts, NAS boxes, databases, and home lab servers.
Formula Breakdown
| Workload | Typical read/write mix | Common block size | Planning concern |
|---|---|---|---|
| Virtualization host | 60-80% read, bursty writes | 8-32 KB | Noisy neighbors, snapshots, boot storms, and datastore latency. |
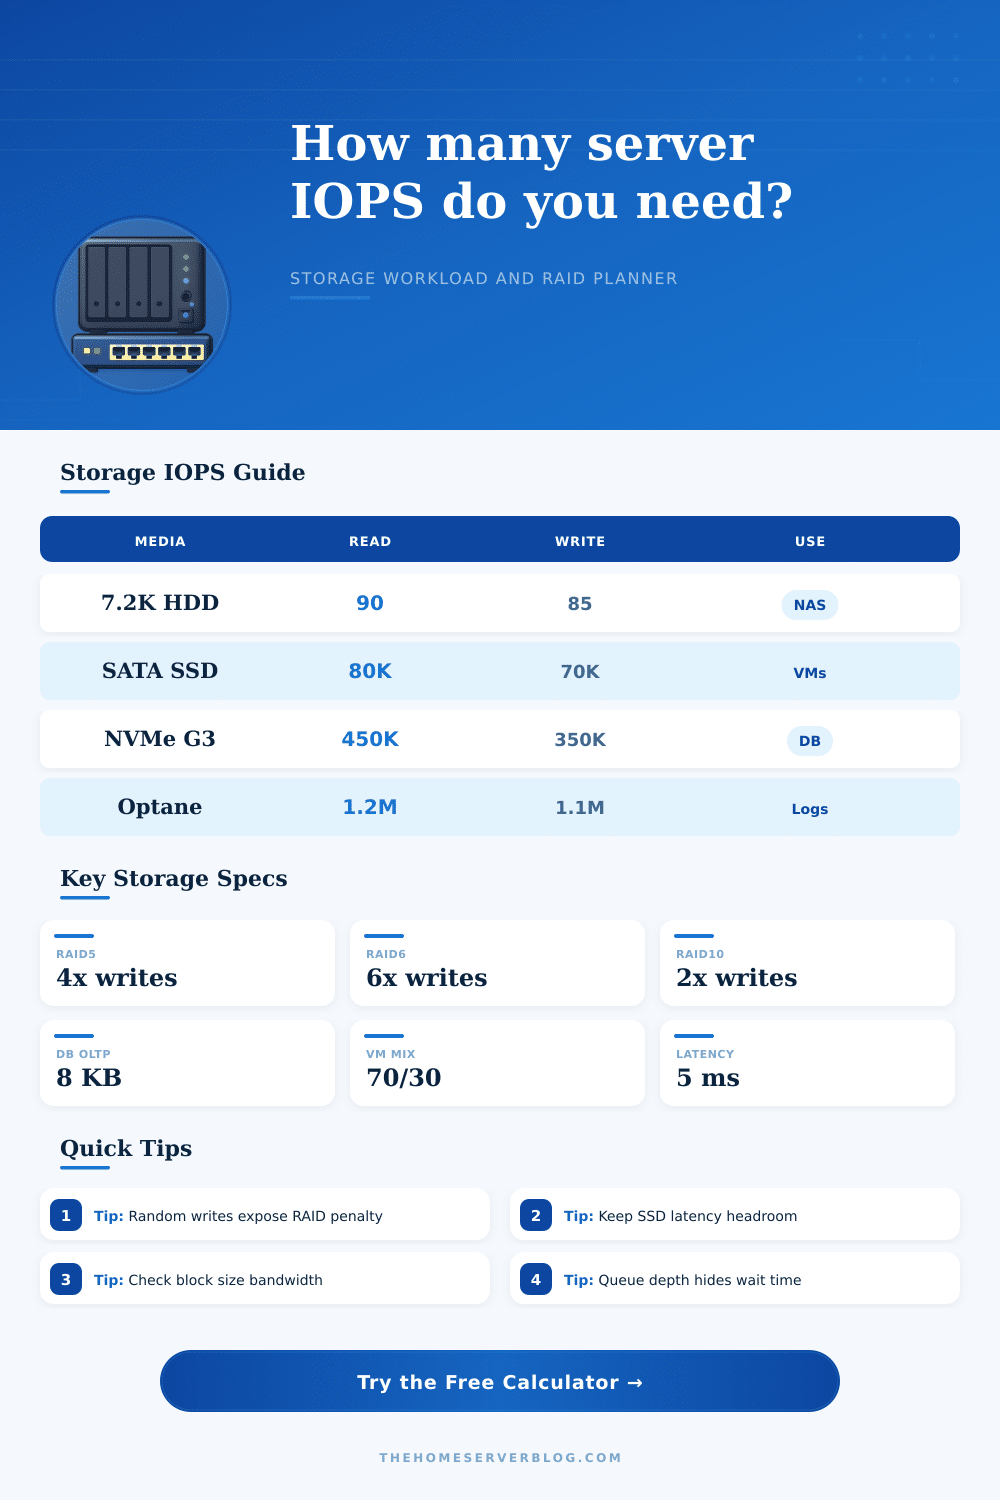
| Database OLTP | 60-75% read with sync writes | 8 KB | Small random writes, journal latency, and cache warm-up time. |
| NAS file sharing | 70-90% read in many homes | 64-1024 KB | Bandwidth may dominate once SSD cache absorbs metadata. |
| Logging and ingest | 10-40% read, heavy writes | 4-64 KB | Write amplification, endurance, and flush latency matter. |
| VDI login storm | 80-95% read bursts | 4-16 KB | Short spikes can exceed steady-state disk pool capability. |
| RAID layout | Read scaling | Write penalty | Practical interpretation |
|---|---|---|---|
| Single disk | 1 drive | 1x | No redundancy; useful only for scratch or replicated application tiers. |
| RAID 0 | All drives | 1x | Fast but unsafe for persistent server data without replication. |
| RAID 1 | Up to both mirrors | 2x model | Great small server baseline; writes land on both devices. |
| RAID 5 / RAIDZ1 | Most drives | 4x | Random writes pay read-modify-write parity overhead. |
| RAID 6 / RAIDZ2 | Most drives | 6x | Safer rebuild posture, but random writes are expensive. |
| RAID 10 | All drives | 2x | Strong random IOPS choice for VMs and databases. |
| Media class | Typical read IOPS | Typical write IOPS | Use in home server planning |
|---|---|---|---|
| 7.2K SATA HDD | 75-110 | 70-100 | Bulk storage, backups, sequential media libraries. |
| 10K or 15K SAS HDD | 130-190 | 120-180 | Legacy arrays; often beaten by a single SSD. |
| Enterprise SATA SSD | 60K-100K | 40K-80K | Reliable VM datastore with simple cabling and low power. |
| PCIe Gen3 NVMe | 300K-600K | 200K-450K | Databases, cache pools, and dense containers. |
| PCIe Gen4 NVMe | 700K-1M | 500K-900K | High-concurrency storage when CPU and cooling keep up. |
| Project size | Example drive tier | Target IOPS | Secondary metric to watch |
|---|---|---|---|
| Small NAS with apps | 4 HDDs plus SSD cache | 300-800 | Metadata cache hit rate and scrub windows. |
| Compact Proxmox box | 2 NVMe mirror | 5K-25K | Sync writes, backup jobs, and guest queue depth. |
| Home database server | 4 SATA SSD RAID10 | 20K-80K | Write latency, WAL or journal device behavior. |
| Media and backup host | 6-8 HDD RAIDZ2 | 500-2K | Sequential throughput and resilver performance. |
| Dense lab cluster | 4-8 NVMe striped mirrors | 100K+ | PCIe lanes, thermals, and network bottlenecks. |
This calculator gives planning estimates. Validate final storage design with real workload traces, fio or diskspd testing, controller cache policy, sync-write settings, drive endurance, thermal behavior, and backup windows.
Storage performance is dependent upon a specific measurement of IOPS. IOPS is the number of input and output operations that a storage system can perform each second. Many people do not notice the importance of IOPS until there storage system is slow.
Furthermore, many people do not consider IOPS until they have already purchased the drive that they will install into their RAID system. Storage performance is not related to the amount of data that can be stored, but rather to the ability of the drives to handle the specific type of reads and writes that will occur on the storage system. Raid systems must be able to handle the type of workload that will be performed upon the data that is stored on the drives.
How IOPS and RAID affect storage speed
For instance, virtualization hosts tend to have an even number of reads and writes to be performed upon their virtual machine, but may have long periods of spikes in the amount of reads and writes that is required. Database server may have smaller blocks of data read from and written to the drives, but the amount of writes that occur to database servers can be significant relative to other types of servers. File server and network-attached storage (NAS) box may have long periods of data reads from clients and long streams of writes to the data that is stored on the NAS box.
Long streams of writes can overwhelm RAID systems based off parity, and can lead to deep queues of I/O requests waiting to be serviced by the RAID controller. A calculation tool is provided to calculate the math behind these various workload and drive types. Raid systems can exhibit a loss of storage system performance due to the RAID penalty.
Raid systems that use parity lose storage system performance with each small write to a drive because it must also read from the drives to calculate the parity data that will replace the data that was written to the drive. This penalty is not noticeable during the copying of file of large sizes, but can be immediately visible when small amounts of writes occur to the storage system, such as with database or virtual machine servers. Raid systems that use mirroring avoid the RAID penalty but offer less raw storage data to the systems that use the RAID system.
Your RAID system selection requires a choice between read-heavy and write-heavy workloads, and a choice between RAID systems that offer raw storage data versus RAID systems that provide better latency access to the storage data. The calculator also accounts for the RAID penalty. The type of media that is used within a storage system will impact the performance of the storage system.
Hard drive media can deliver fewer IOPS than solid-state drives, and the performance drops off with the increase in queues of I/O requests waiting to be serviced by the drives. Solid-state drives can offer high IOPS rates, but have limitation in their own. NVMe drives offer even higher IOPS than the other type of drives, but can exhibit bottlenecks in their own.
The calculator allows for the different types of media to be swapped out in the calculation of the RAID system. Raid systems may exhibit differences in their calculations due to the hit rate of the cache. If an RAID system has a high hit rate for the reads that is requested of it, then there will be fewer IOPS requirements from the drives that are within the RAID system.
Other factors that impact RAID systems include the efficiency of the RAID system controller and filesystem. Both of these elements lose some of the storage system’s performance to other processes, such as RAID system protocols and RAID system snapshots. It is recommended to allow for some headroom within the RAID system for these process.
Latency is another RAID system factor that most people do not consider until the RAID system is running. Despite being able to deliver the IOPS that are required of it, a RAID system can still feel slow if the requests to access the drives sit in a queue. The RAID system calculator will estimate the latency that the RAID system will experience at the target IOPS load.
Setting the RAID system queue depth can impact the latency within the RAID system, but does not impact the capabilities of the drives themselves. Most planning mistake occur due to incorrect assumptions. Many people only size a RAID system for its storage capacity.
Others ignore the RAID penalty that is created by RAID systems with parity data. Others consider only peak IOPS for RAID systems, rather than the sustained IOPS that may be required to handle the workload of the servers that they will implement into the RAID system. These mistakes will cause a RAID system to struggle with IOPS requirements once the traffic arrive at the data.
It is important to honestly describe the RAID system workload, account for RAID penalties and requirements for backups, then ensure that there is enough headroom in the RAID system for these additional tasks. The decision to implement a RAID system involves a series of tradeoffs. The RAID system calculator will help you to understand these tradeoffs prior to purchasing the RAID drives.
Once you have determined that a RAID system will meet the requirement of your servers and workloads, it is recommended to test the RAID system itself to ensure its reliability.