Fiber Optic Latency Calculator
Estimate one-way and round-trip fiber delay from distance, group index, route factor, slack, optics, FEC, switch hops, queue allowance, and Ethernet serialization.
⚙Named fiber presets
Presets fill realistic fiber types, path multipliers, optics, FEC, and switching assumptions, then calculate automatically.
📏Fiber path and equipment inputs
Fiber latency results
📊Calculated spec grid
The spec grid separates propagation from path inflation, so you can see whether distance, routing, optics, or devices dominate the result.
📚Fiber latency reference tables
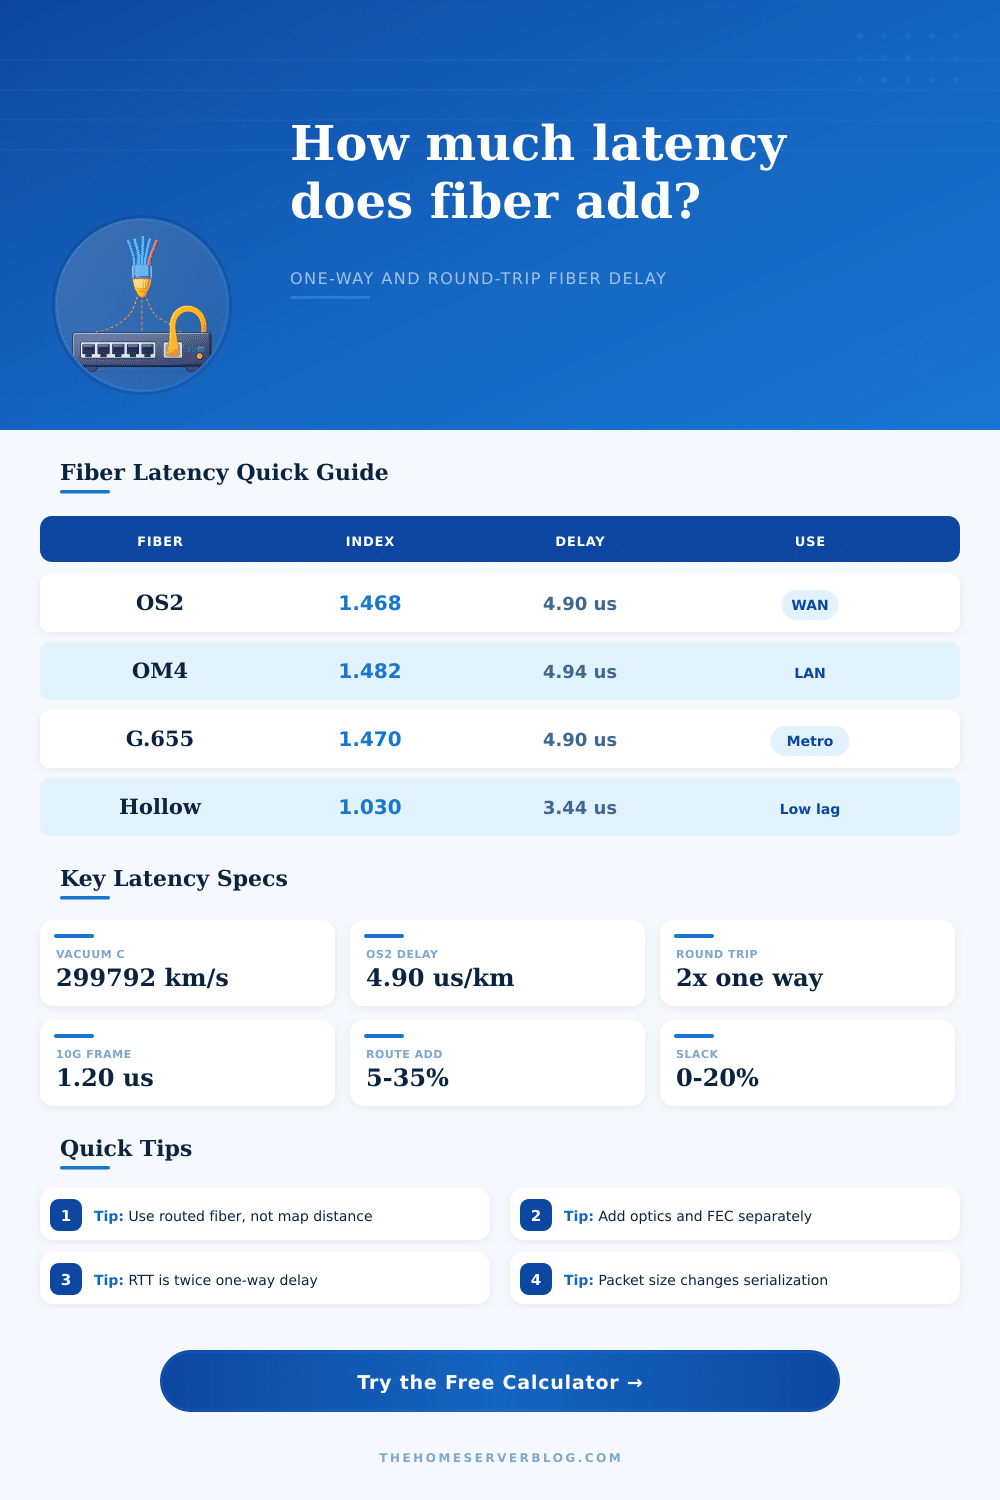
| Fiber or medium | Typical group index | Propagation delay | Best planning use |
|---|---|---|---|
| OS2 G.652.D single-mode | 1.467 to 1.468 | About 4.89 to 4.90 us/km | Home fiber, metro, enterprise WAN, carrier access |
| G.655 NZDSF | About 1.470 | About 4.90 us/km | Long-haul wavelength services and older carrier routes |
| G.657 bend-insensitive | About 1.468 | About 4.90 us/km | Indoor drops, FTTH, risers, tight trays |
| OM4 multimode | About 1.482 | About 4.94 us/km | 850 nm data center and campus links |
| OM5 wideband multimode | About 1.482 | About 4.94 us/km | Short reach multi-wavelength multimode systems |
| Subsea single-mode span | About 1.468 | About 4.90 us/km | Ocean routes with repeater and landing-station overhead |
| Hollow-core fiber | About 1.03 | About 3.44 us/km | Specialized low-latency routes and labs |
| Direct attach copper | About 1.30 equivalent | About 4.34 us/km equivalent | Very short rack references where electronics dominate |
| Equipment element | Typical one-way delay | Where it appears | Practical note |
|---|---|---|---|
| Passive connector pair | Near zero, modeled as 0.002 us | Patch panels, LIUs, ODFs | Usually important for loss, not latency. |
| SR or LR Ethernet optics | About 0.05 to 0.12 us | SFP, SFP+, SFP28, QSFP modules | Small compared with kilometers of fiber. |
| RS-FEC Ethernet | About 0.12 to 0.25 us | 25G, 50G, 100G, 400G links | Mode and silicon implementation vary. |
| Store-and-forward switch | About 2 to 10 us | Access, aggregation, routed edges | Cut-through platforms can be much lower. |
| PON access system | Several to tens of us | ONT to OLT and scheduling | Dynamic bandwidth allocation can dominate short fiber. |
| Coherent transponder | Several microseconds | Long-haul waves and DCI | DSP and strong FEC are often the main non-fiber delay. |
| Scenario | Distance planning range | Route factor | Latency focus |
|---|---|---|---|
| Rack or row fiber patch | 3 to 100 m | 1.00 to 1.10 | Switch, optics, and serialization dominate. |
| Home lab to garage or office | 10 to 300 m | 1.05 to 1.25 | Slack loops and switch hops matter more than fiber. |
| Campus backbone | 0.5 to 10 km | 1.10 to 1.35 | Duct path and aggregation switches are visible. |
| Metro data center interconnect | 5 to 80 km | 1.15 to 1.45 | Route diversity often adds more delay than optics. |
| Regional WAN | 80 to 800 km | 1.15 to 1.60 | Fiber propagation becomes the dominant term. |
| Subsea route segment | 500 to 10000 km | 1.05 to 1.30 | Landing route, repeaters, and regeneration matter. |
| Line rate | 64-byte frame | 1500-byte frame | 9000-byte frame |
|---|---|---|---|
| 1G Ethernet | 0.512 us | 12.000 us | 72.000 us |
| 10G Ethernet | 0.051 us | 1.200 us | 7.200 us |
| 25G Ethernet | 0.020 us | 0.480 us | 2.880 us |
| 100G Ethernet | 0.005 us | 0.120 us | 0.720 us |
| 400G Ethernet | 0.001 us | 0.030 us | 0.180 us |
💡Fiber latency planning tips
Fiber optic latency are the delay in the transmission of data that result from the light traveling through the glass fiber. Several different factor cause the delay (or latency) of fiber optic data transmission. For instance, latency isnt a number that is provide to you on a map.
Instead, the latency is the sum of the distance traveled by the light, the bends in the fiber in relation to the light, and the extra distance that the need to follow certain street and install the fiber in certain ways may be introduce into the path of the data. As a result, you can use the calculator to determine the latency of the fiber optic data transmission by entering the distance that the data will travel, the route that the fiber will take, and the latency input for the equipment. The calculator will save you the trouble of having to manually calculate the latency of the fiber optic data signal, but you will have to decide on the correct value for the equipment inputs.
Fiber Optic Delay: What Causes It and How to Calculate It
Light travels at a slower rate through glass than it do through the air. This is referred to as the group index of the fiber. The group index change with the type of fiber used in the fiber optic run.
For instance, most single mode fiber that is used for metro and long haul data link has a group index of 1.468. At this value of the group index, the fiber will introduce approximately 4.9 microseconds of delay for every kilometer of fiber. Multimode fiber, which is used most often in data center and buildings, has a slower group index than single mode fiber.
Hollow core fiber has a group index that is closest to 1.03. Because the group index of hollow core fiber is closer to 1.03 than the other types of fiber, it will reduce the amount of propagation of the data signal by thirty percent. The propagation time difference becomes more important in the context of long spans of fiber, as the fiber itself is the largest contributor to the latency of the data signal over long distances.
As with any installation, the data will not travel in a straight line from point A to point B. It is necessary to follow certain street and to install the fiber in specific location. As a result, there will be an extra distance that the data signal travels beyond that calculated from a map of the area. For instance, a metro link that is twenty kilometers on a map may be twenty-five or twenty-eight kilometers in length if the fiber is installed along the shortest route.
In addition to the distance required to follow the streets, there are often additional length of fiber used in service loops and slack that is installed in handholes or patch panels. These additional length of fiber can be accounted for in the calculator by adjusting the route factor and the slack percentage. By adjusting these two factor, the length of the fiber can be modeled to account for the actual length of the fiber that is to be installed.
Equipment will also add to the latency of the data signal. Each switch and router introduce some delay in the data traveling through that device; this is referred to as processing delay. Processing delay adds to the total latency of the data signal traveling through the network.
Many link implement forward error correction to improve the bit-error rate in the data signal. However, introducing forward error correction also introduces delays in the signal as the signal travels through the silicon of the switch or router. Additionally, each optic will introduce a small amount of latency into the signal.
Serialization delay is another contributor to the total latency; the longer the data frame and the lower the data rate, the greater the serialization delay. These non-fiber term become the dominant contributor to latency on very short data link. For instance, the switches could dominate the latency for a one kilometer data link within a data center rather than the fiber.
The reference tables will provide you with the values that you can use in the calculator to determine the latency of your fiber optic data signal. The first table will list the propagation delays that is associated with the different types of fiber. The second will list the serialization times at different line rates.
The third will list the delay introduced by active network equipment. These listed value are a starting point for the latency of your signal, but these number are not guarantees. The actual latency of your signal may vary with the specific equipment used and its settings.
However, you can replace the default number with the actual measured value from similar equipment. To make the decision of the settings for the calculator easier for you, it is useful to separate the value that you can control versus the values that you cannot control. For instance, the distance and the route factor are two value that you cannot control.
The geographical area in which the data link will be installed sets them. However, the fiber type and the line rate are two factor that you may be able to control. For instance, the individual that are setting up the network can negotiate the line rate.
Additionally, the queue allowance and the number of switch can also be modeled in the calculator. For instance, by increasing the queue allowance the data signal will be allowed to wait at the switch for additional data to arrive. This can be used for the inclusion of additional security appliance at the switch or to allow for bursty traffic at the link.
However, the queue allowance will not change the fiber calculation for the link. There are some mistake that many individual make when they calculate the latency of a fiber optic data signal. For instance, many individual enter the distance between two point from the map into the calculator, but they do not account for the route factor for the distance that the signal will travel.
This factor can lead to underestimations of the latency of the signal by ten to thirty percent. Many individual also make the same mistake with switches; they do not account for the difference between access switches and core routers. Additionally, many individual ignore the serialization delay for data signal that contain large frame of data at relatively low line rate.
While the calculator does not prevent these mistake from occurring, the calculator will provide you with a better understanding of the effect of each of these mistake. The maximum margin for error for latency is narrow. For financial trading network, for instance, there may be an added delay to the signal of only single-digit microseconds when traveling across a metro area.
Additionally, other network, such as those that are used in video production may require that the signal has a certain amount of jitter, not that it is introduce with a specific latency. However, the latency of the signal itself can still impact the decisions of the networks engineering team regarding latency guarantees; they cannot guarantee a latency that their physics will not allow them to achieve. You can make an estimate for the latency of a data signal through the calculator.
This estimate can take into account the actual path that the signal will travel and the length of the link in kilometers. When you have the as-built drawing for the link or have walked the link, you will have a better understanding of the actual signal path. The calculator will calculate the one-way and round-trip latency of the signal, and you can compare these value to the latency requirement of your application.
This comparison of latency to application requirement is when you will exercise the most engineering judgment.