Response Time Calculator
Estimate browser, network, protocol, server, queue, database, cache, and payload transfer delay for a home server, API, reverse proxy, VPN, or self-hosted app.
⚙Named response time presets
Each preset fills a realistic app profile, RTT, handshake mode, concurrency, cache rate, payload size, throughput, and server timing mix.
⏱Response path and server timing inputs
The model adds protocol handshakes, DNS, network RTT, upload serialization, server work, database work, queue wait, cache misses, response transfer, asset waterfall time, retries, jitter, and buffer.
Estimated response time
🖧Equipment spec grid
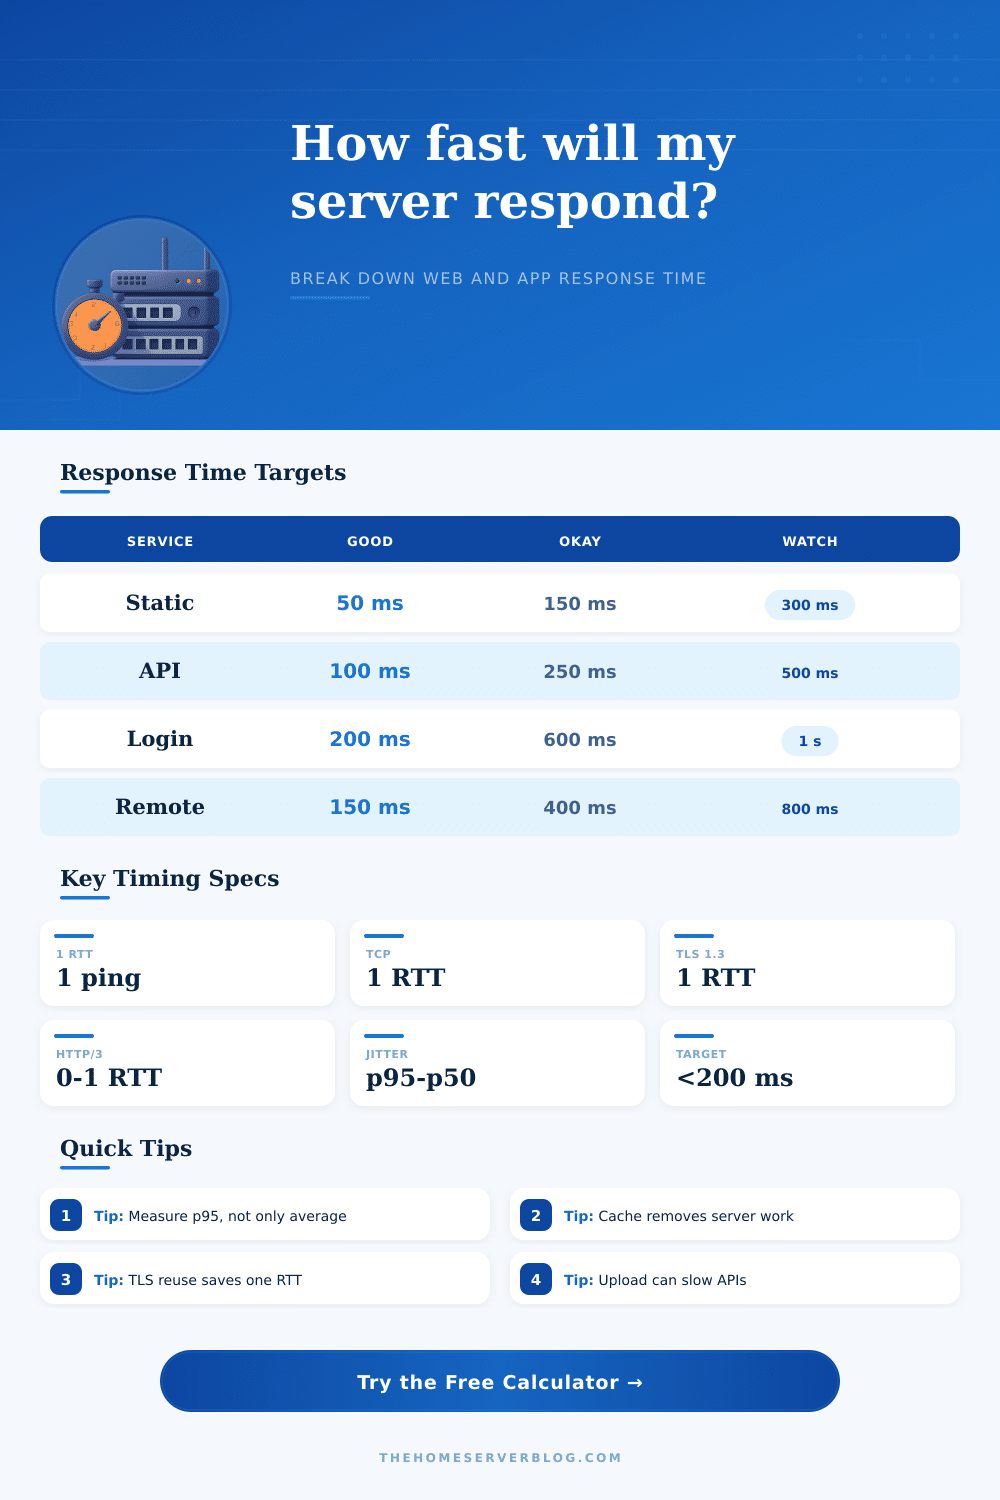
📊Response target table
| Service type | Excellent p95 | Usable p95 | Planning note |
|---|---|---|---|
| Static page or cached docs | Under 80 ms | 80 to 250 ms | Network route usually matters more than server CPU. |
| Reverse proxy to simple app | Under 150 ms | 150 to 350 ms | Keep-alive reuse and upstream pooling save handshakes. |
| JSON API endpoint | Under 120 ms | 120 to 300 ms | Small payloads reveal queueing and database time quickly. |
| WordPress or PHP app | Under 250 ms | 250 to 800 ms | Object cache, page cache, and PHP workers decide p95. |
| Media library dashboard | Under 300 ms | 300 ms to 1 s | Thumbnails and metadata queries create long waterfalls. |
| Remote admin over VPN | Under 250 ms | 250 to 700 ms | VPN handshake, MTU, and upload asymmetry can dominate. |
🔗Protocol and handshake table
| Protocol mode | Typical RTT cost | Best use | What to tune |
|---|---|---|---|
| HTTP/1.1 cold HTTPS | About 3 RTT | Legacy clients, simple servers | Enable keep-alive and reduce redirects. |
| HTTP/2 cold HTTPS | About 3 RTT | Modern browsers and reverse proxies | Multiplex assets and reuse TLS sessions. |
| HTTP/2 warm connection | About 1 RTT | Logged-in dashboards | Increase idle timeouts and upstream pooling. |
| HTTP/3 QUIC first visit | About 2 RTT | Mobile and lossy paths | Check UDP reachability and fallback behavior. |
| HTTP/3 resumed | About 1 RTT | Repeat clients | Use session tickets and stable edge routing. |
| VPN plus HTTPS | About 4 RTT | Private admin access | Watch MTU, cipher speed, and tunnel route. |
💾Server component timing table
| Component | Fast range | Slow signal | Home lab lever |
|---|---|---|---|
| Reverse proxy routing | 1 to 10 ms | More than 30 ms | Use local upstreams, connection pools, and fewer redirects. |
| PHP or app runtime | 20 to 150 ms | More than 500 ms | Increase workers, use opcode cache, and remove blocking calls. |
| Database query set | 5 to 100 ms | More than 300 ms | Add indexes, cache common reads, and avoid slow disks. |
| Object or page cache miss | 10 to 80 ms | More than 250 ms | Warm cache, tune TTLs, and cache generated fragments. |
| Queue wait | 0 to 50 ms | More than 200 ms | Add workers or lower concurrency with rate limits. |
| Payload transfer | 1 to 100 ms | More than 500 ms | Compress, resize images, and reduce dashboard assets. |
🧮Common project sizes table
| Scenario | Typical inputs | Primary result | Secondary result |
|---|---|---|---|
| LAN static site | 2 ms RTT, warm HTTP | Often below 40 ms | Server processing is tiny. |
| Remote blog through proxy | 25 ms RTT, PHP, cache | Usually 250 to 700 ms | Cache misses decide p95. |
| Home API for automations | 12 ms RTT, small JSON | Often 80 to 220 ms | Queueing shows up during bursts. |
| Photo gallery outside home | 40 ms RTT, large thumbnails | Often 600 ms to 2 s | Payload and metadata queries dominate. |
| VPN admin dashboard | 45 ms RTT, tunnel overhead | Often 400 ms to 1.2 s | Handshake and MTU issues matter. |
| Edge cached public page | 12 ms RTT to edge | Often 40 to 150 ms | Origin time mostly disappears. |
💡Response time calculation tips
A response time calculator can help you to understand why a web service might seem slow. When using a web service, there are a number of small amounts of delay that occur, and those small delays can add up to create a significant delay in the response time for a request. The response time calculator allow users to see those individual delays by breaking the total delay time into it’s separate component.
The first component to consider is the time that it takes for the request to travel from the user to the server. This travel time include steps like DNS lookups, TCP handshakes, and TLS handshakes. When a fresh connection makes a request, there are multiple “round trips” that must occur to complete each of these steps.
How a response time calculator works
A warm connection, however, reuses an existing connection between the user and the server, which reduce the number of round trips that is required for the request to travel to the server. Thus, the warm connection results in a faster response time then that of a fresh connection. These types of calculation can be seen within a response time calculator.
The second component is the time that it takes for the server to perform its work. This include the running of application code, database queries, and cache checks. Factors like the cache hit rate will impact the amount of work that the server have to perform to fulfill the request.
If the cache hit rate is high, then the server will perform less work than if the hit rate is low. The response time calculator allow users to adjust these settings to see how they may impact the response time. The third component is the amount of time that a request must wait in a queue to be processed by the server.
This waiting time occur when the server receives more requests than the number of workers that can handle those request. Thus, requests must wait in a queue for processing, and any time that a request spends in that waiting queue is invisible in response time calculation for individual requests. However, during times of high loads on the server, the waiting time for requests in the queue becomes very significant.
The response time calculator allow users to consider the number of workers that are assigned to handle requests to calculate the waiting time for requests in the queue. The fourth component is the time that it takes to transfer the data between the server and the user. This component of response time is affected by the size of the data (payload) that is to be transferred between the two endpoints, as well as the throughput that can be achieved between those two endpoints.
Large payload (data amounts) may result in long response times due to the amount of time it takes to transfer such large amount of data. Additionally, the size of data that is uploaded from the user to the server (as in API call) can also impact the response time. Because upload speed may not be the same as download speeds, separate upload and download throughput value are used in the response time calculator.
The fifth component is the amount of jitter and the number of times that the request must be retried. Data jitter refer to the variation in the time that it takes for data to travel between the two endpoints. Additionally, data might become lost during travel between the two endpoints, which force the request to be sent again (retransmitted).
Thus, any number of retries will cause the time it takes for each retransmitted request to travel from the server to the user (and vice versa) to increase the response time. These two factor can be included in the response time calculator. By using such a response time calculator, the developer can determine which component of the web application are causing the greatest part of the delay in response time.
For instance, if the time for TCP and TLS handshakes is the largest portion of the response time, then the developer may wish to focus upon reducing the number of handshake between the user and server. Likewise, if the response time for server work is the greatest portion of the response time, then the developer may wish to focus upon the cache configuration and the number of worker process that are assigned to handle the requests from users. Additionally, if the waiting time for requests to arrive in the request queue is the largest component of the response time, then the developer may wish to increase the number of worker.
If the transfer time between the user and the server is the major component of the response time, then the developer may wish to focus upon the size of the payloads of data that must be transferred between the two endpoints. Thus, the response time calculator allow a developer to stop asking the question of whether the server is slow, or whether there are error in response time, and to instead begin to ask the question of which component of the system is causing the slowdown.