MTBF to Failure Rate Calculator
Convert server, NAS, disk, fan, PSU, and network MTBF specs into lambda, FIT, AFR, mission reliability, fleet expected failures, and tolerance-adjusted outage risk.
This calculator uses the constant failure rate exponential model: reliability R(t) = exp(-lambda t), failure probability F(t) = 1 - R(t), and lambda = 1 / MTBF.
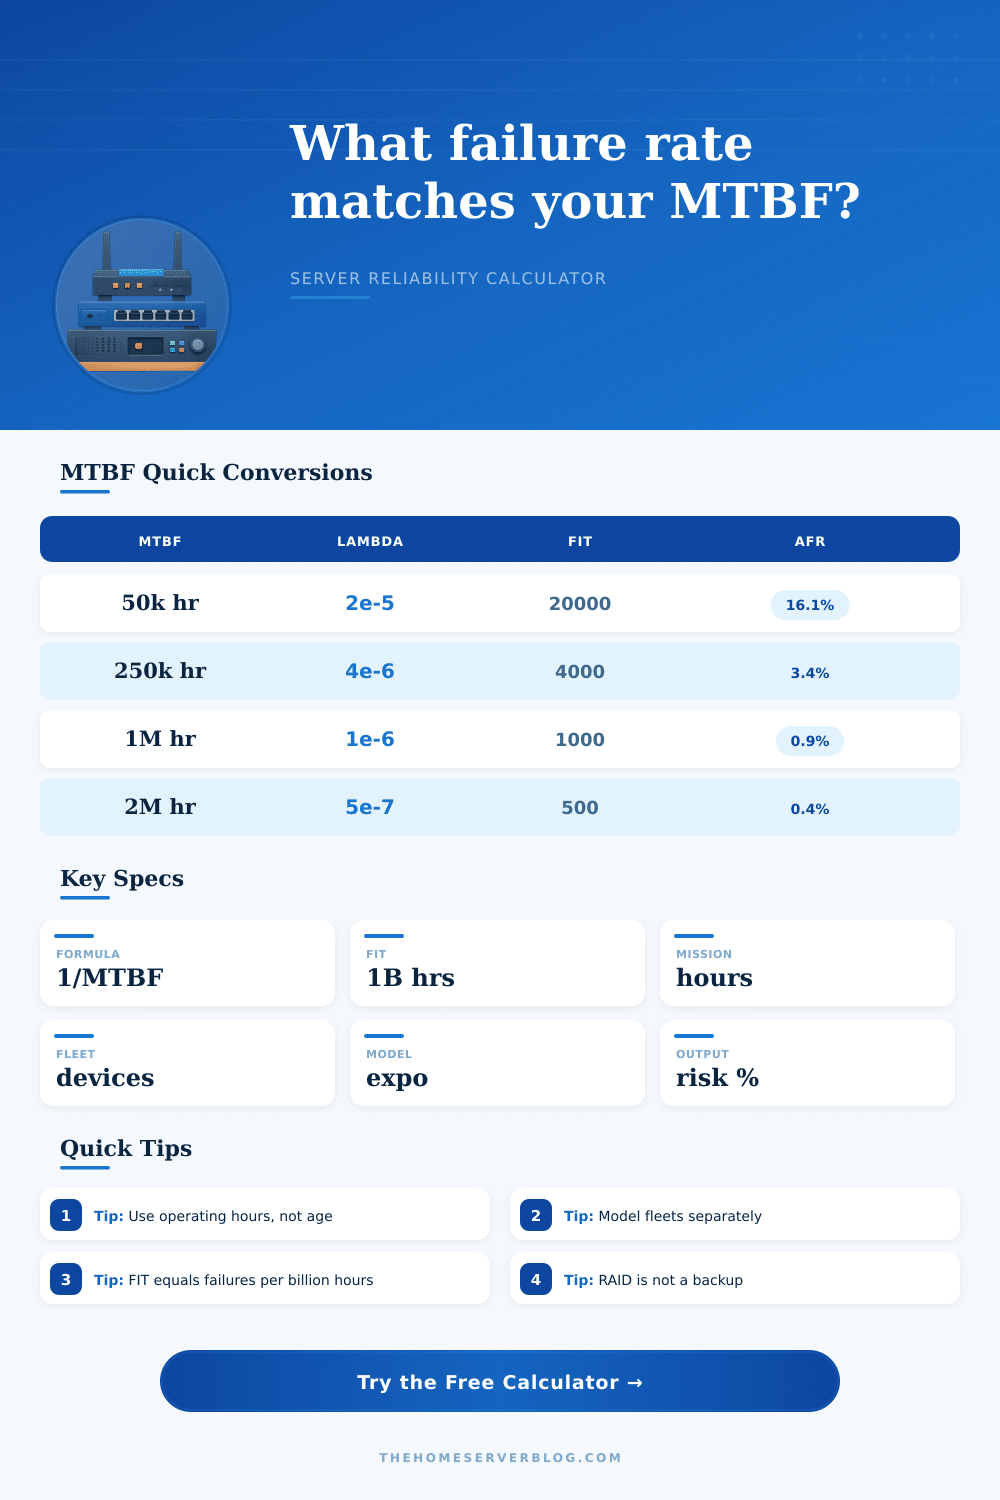
| Published MTBF | Lambda per Hour | FIT | Single Item AFR |
|---|---|---|---|
| 50,000 hours | 2.000e-5 | 20,000 | 16.05% |
| 250,000 hours | 4.000e-6 | 4,000 | 3.44% |
| 1,000,000 hours | 1.000e-6 | 1,000 | 0.87% |
| 2,000,000 hours | 5.000e-7 | 500 | 0.44% |
| Preset | MTBF | Fleet | Typical Mission |
|---|---|---|---|
| 8-Bay NAS HDD Pool | 2,000,000 hr | 8 drives | 36 months |
| Consumer SSD Mirror | 1,500,000 hr | 2 drives | 60 months |
| NVMe Cache Pair | 1,800,000 hr | 2 drives | 24 months |
| Boot USB Mirror | 300,000 hr | 2 sticks | 12 months |
| Rack Fan Wall | 70,000 hr | 6 fans | 36 months |
| Mission | Single Reliability | Fleet Failure Risk | Expected Failures |
|---|---|---|---|
| 30 days | 99.93% | 0.29% | 0.003 |
| 1 year | 99.13% | 3.45% | 0.035 |
| 3 years | 97.41% | 10.02% | 0.104 |
| 5 years | 95.72% | 16.08% | 0.171 |
| Output | Formula | Current Value | Use It For |
|---|---|---|---|
| Lambda | 1 / MTBF | 1.000e-6 | Base rate |
| FIT | lambda x 1e9 | 1,000 | Datasheets |
| R(t) | exp(-lambda t) | 99.00% | No-failure odds |
| Fleet risk | 1 - R(t)^n | 3.94% | Spare planning |
Reliability numbers on the datasheets for different hardware component are abstract numbers. These abstract numbers is only realy understood once the hardware component in question fails during the project in which it is being utilized. Beyond understanding the abstract reliability statistics provided by the hardware manufacturers, you can use the calculator to determine a set of numbers that will enable planning of the hardware components mission.
These calculations can be performed regardless of the size of the hardware installation, whether it is a few components in a small home laboratory setup, or whether it is a large installation of storage or network hardware. Mean Time Between Failures (MTBF) is a reliability statistic that the user calculates based upon testing of the hardware components or based upon actual field data from those components. The MTBF statistic indicates the length of time that a component will operate before it experiences a failure.
Use MTBF to Plan Hardware Reliability
The MTBF statistic only indicates this length of time should component failures occur at a constant rate; otherwise, the statistic does not accurately reflect the reliability of that component. The calculator determines a failure rate for the component by taking the published MTBF for that component and converting the MTBF to an hourly failure rate (lambda). The calculator also factors in mission length, duty cycle, fleet size, and environment to calculate mission reliability and expected failures for that component.
Each of the factors that the calculator considers have an impact upon the reliability of the component. Factors such as the environment in which the component operates and the length of time during which the component is to operate will impact that components reliability. Additionally, the size of the installation (fleet size) will also have an impact upon the expected failures of that component.
You can enter each of these factors into the calculator to determine the MTBF, the lambda rate, the FIT rate, the mission reliability, the expected failures for the fleet, the probability of exceeding redundancy tolerance, and the binomial tolerance for that component. While the statistic of MTBF may seem to suggest that a component will be reliable during its missions, the statistic is actualy only an average of the length of time that the component will operate between failures. Therefore, treating the statistic as if it is a guarantee for the component will lead to underestimations of the likelihood of those failures.
The constant failure rate assumption for the component statistic actually does not suggest that the component failures will cluster over time during either the beginning or the end of the component’s lifespan; however, an understanding of the component’s lifespan and the wear of its parts does permit an inspection for possible failures outside of those assumptions provided by the calculator. The strategy that you apply to the hardware components will interact with the redundancy settings for those components. For instance, if the failed component can be replaced within one day, the risk of a second failure is less than if the component fails and takes a week to be replaced.
These different scenarios for component failure can be tested in the calculator to determine the effect that changing the repair window will have upon the number of component failures. In addition, you can alter the number of allowed failures for the component to determine why people may wish to maintain hot spares for a hardware installation. This same calculation can be applied to components of similar categories.
For instance, fans and power supplies will have lower reliability statistics than storage devices, but the fans and power supplies will be in the same rack as the components that are powered by those power supplies. Additionally, each of the components will perform the same workloads. Therefore, treating each component as if it has the same mission length and environment factor will allow the technician to determine which components will pose a higher risk of failure for the installation.
The same strategies can be applied to each of the different categories of hardware components. For instance, while each switch may have a modest MTBF statistic, the risk of failure of that switch to perform its functions will be higher than that of any installation of storage devices if the switch does not feature redundancy in its design. Many errors are made in planning of the hardware installation that may lead to inaccuracies in the calculation of the component reliability.
For instance, different units may be applied to each statistic; for instance, some components may be rated in hours while others are rated in years. Additionally, the duty cycle for components may not be represented at 100% for those stand-by spares if the component should fail. These factors will be accounted for within the calculator.
Additionally, the calculator allows for scenarios to be tested with the same components and with different settings for those components. For instance, when determining which settings will lead to the most impact upon the redundancy of the installation, the calculator will permit those scenarios to be tested to determine the best strategy to implement within the installation. While the calculator may suggest that the highest possible MTBF statistic for any components is the goal of the installation and setup of those components, that goal can quickly be discarded in favor of determining what the MTBF statistic will reveal about the installation.
Therefore, understanding these variables will allow for the remainder of the planning of that installation to be made in a straightforward manner. You should of considered the mission length more carefully.