SSD Endurance Calculator
Estimate TBW life, DWPD usage, per-drive RAID writes, write amplification, overprovisioning impact, and safe daily host writes for NAS and home server SSDs.
Choose a realistic starting point, then adjust the TBW, DWPD, RAID layout, retention period, and write amplification to match the drive datasheet and workload.
SSD Endurance Results
Breakdown
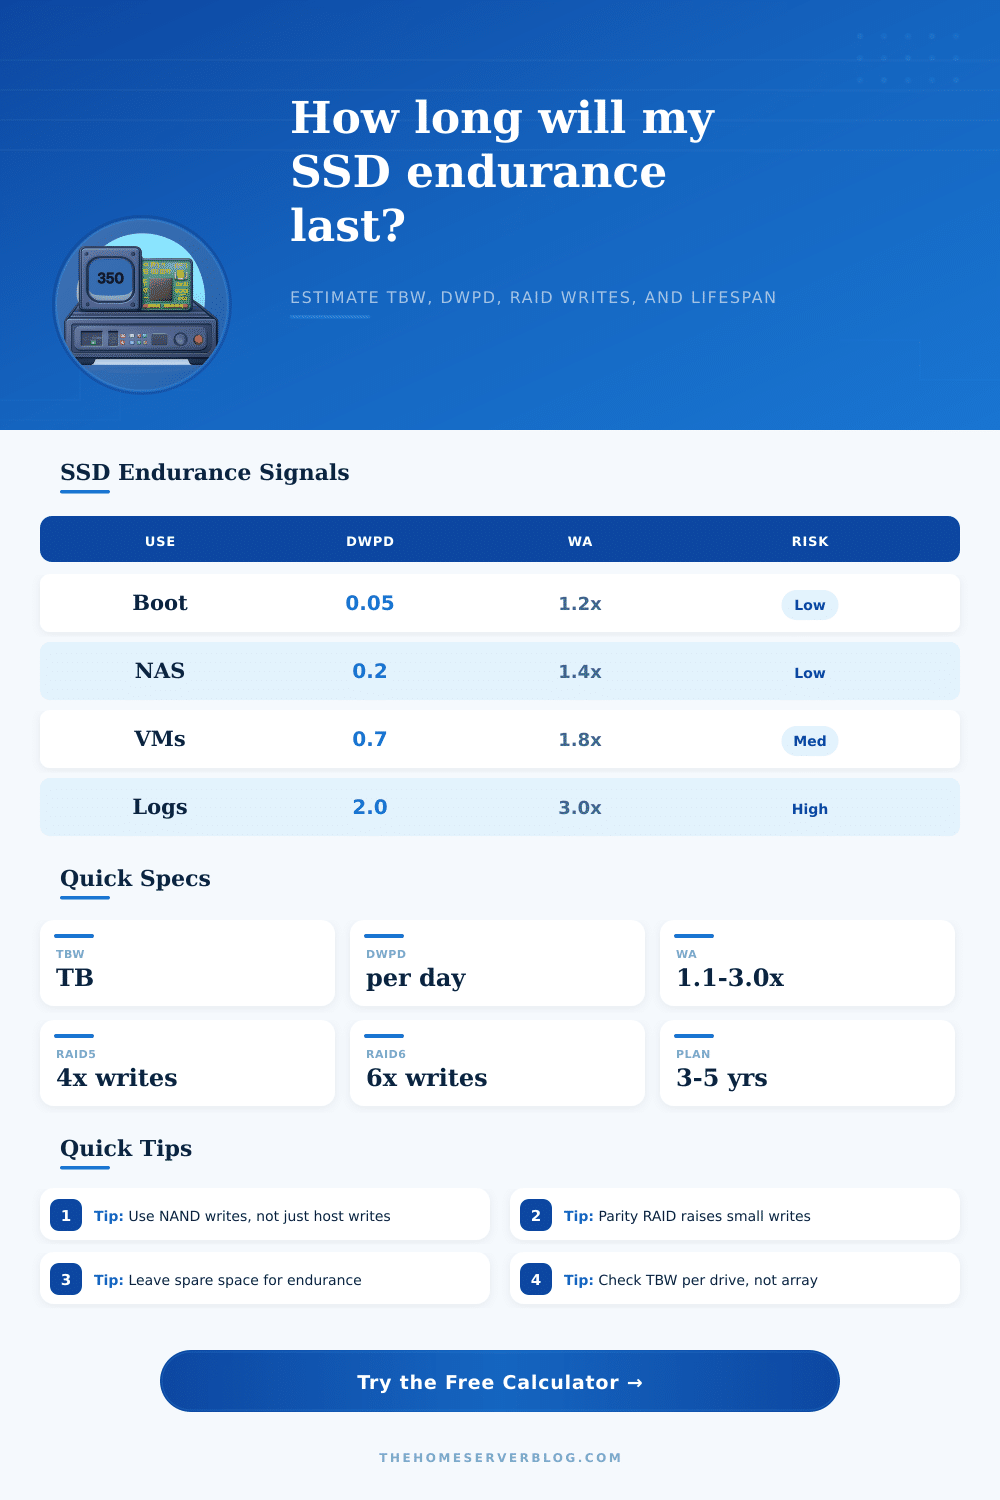
| DWPD Used | Typical Meaning | Home Server Fit | Action |
|---|---|---|---|
| Under 0.10 | Very light write duty | Boot SSD, media index, light services | Consumer or NAS SSD is usually fine |
| 0.10 to 0.50 | Steady NAS and VM writes | Mirrored app storage, small databases | Check TBW and keep free space |
| 0.50 to 1.00 | Heavy home lab workload | VM datastore, cache, sync target | Prefer NAS or enterprise read SSD |
| 1.00 to 3.00 | Mixed-use enterprise territory | Database, logs, NVR, busy cache | Use enterprise mixed-use endurance |
| Above 3.00 | Write-intensive workload | Large logging, ingest, scratch, analytics | Use write-intensive SSDs or reduce writes |
| Layout | Usable Capacity Model | Total Write Multiplier | Best Use |
|---|---|---|---|
| Single SSD | 1 drive | 1x | Boot, cache, scratch, app disk |
| JBOD / striped | Active drives | 1x | Distributed writes without parity |
| RAID1 / mirror | 1 drive | Active drives x | Small NAS and VM boot pools |
| RAID10 | Half active drives | 2x | VMs and databases needing random I/O |
| RAID5 / RAID6 | N-1 or N-2 drives | 4x or 6x small writes | Capacity pools with moderate writes |
| ZFS RAIDZ1 / RAIDZ2 | N-1 or N-2 drives | 3x or 5x estimate | NAS pools with checksums and parity |
| SSD Class | Typical DWPD | Write Amplification | Common Home Server Role |
|---|---|---|---|
| Consumer SATA / NVMe | 0.1 to 0.3 | 1.2x to 2.5x | Boot, containers, light VM storage |
| NAS / prosumer SSD | 0.3 to 1.0 | 1.2x to 2.0x | Mirrored NAS pool, photo library, apps |
| Enterprise read-intensive | 0.5 to 1.0 | 1.1x to 1.8x | VM images, read-heavy database, replicas |
| Enterprise mixed-use | 1.0 to 3.0 | 1.2x to 2.2x | Virtualization, databases, cache pools |
| Enterprise write-intensive | 3.0 to 10.0+ | 1.1x to 2.0x | Logs, ingest, NVR, high-churn workloads |
| High-capacity QLC | 0.05 to 0.3 | 1.3x to 3.0x | Backup target, media, mostly-read data |
| Profile | Drive Set | Daily Host Writes | Planning Note |
|---|---|---|---|
| Boot SSD | 1 x 500 GB | 10 to 30 GB/day | Low endurance pressure unless logs are local |
| 2-Bay NAS Mirror | 2 x 2 TB | 50 to 250 GB/day | Each mirrored drive receives the writes |
| Proxmox VM Store | 2 to 4 SSDs | 250 GB to 1 TB/day | Snapshots and swap can raise write load |
| NVR Recording SSD | 1 to 4 SSDs | 0.5 to 3 TB/day | Sequential writes are steady but constant |
| Database Pool | 4 x 2 TB RAID10 | 0.5 to 2 TB/day | Random updates may increase amplification |
| Backup QLC Target | 1 x 8 TB or larger | 100 to 500 GB/day | Best for bursts with long idle periods |
When building a NAS or an home server, people must consider the endurance of the SSDs that will serve the server. SSD endurance are the measure of how much data can be wrote to an SSD before it reaches the end of its life. While many consider the initial speed of an SSD when building a home server, the endurance of the drive is also a critical factor.
The endurance of an SSD will dictate how long the SSD will function for a given server. If a person dont plan for the endurance of their SSD, then the drive may fail before they would of imagined. Write amplification is one of the main reason people encounter issues with the endurance of SSDs.
SSD Endurance and Write Amplification for Home Servers
Write amplification is the process by which an SSD increases the amount of writes to the NAND drives that the SSD uses. This is caused by RAID layouts, as the parity calculations that a RAID system performs convert a single write from the host into multiple writes to the drive array by the SSD. RAID layouts increase the total number of writes to the SSD.
By using write amplification calculators, a person can determine how many extra writes a RAID layout will place upon the SSD. Using such a calculator will allow a person to remove the guesswork from their server building efforts. Overprovisioning is another technique that people can use to maximize the endurance of the SSD.
By overprovisioning the SSD, the drive manufacturer leaves part of the SSDs drive as space for internal housekeeping. The extra space allow the SSD to reduce the number of writes to the NAND flash drives. By reducing the number of writes to the SSD, the SSD can reach its Total Bytes Written (TBW) rating more effective.
For SSD endurance, a person must make a distinction between the number of writes to the SSD from the host versus the number of writes to the NAND drives. The number of writes to the host may be measurable and used as a means of determining the size of the SSDs that will be used for a server. However, the actual writes to the NAND drives can be two or three times higher.
By only considering the writes to the host, a person will underestimate the data that will be written to the NAND drives. Using the host write measure alone will result in the SSD wearing out faster than a person may have original predicted. The daily write volume will depend upon the use case of the home server.
For example, a media server may only write out fifty gigabytes of data every day. In contrast, a virtual machine host could write out five hundred gigabytes every day. Additionally, databases and surveillance systems will write much smaller amounts of data each day, but they will have high write amplification when using parity RAID layouts.
By testing these scenarios in a write amplification calculator, a person can determine if the consumer SSD they wish to purchase is sufficient or if they require SSDs with a higher degree of endurance. One of the factors that will impact SSD endurance is the planning period for the SSD. A three-year planning period for an SSD will allow more breathing room for the drives than a five-year planning period.
However, many people often choose a five-year period because that is the length of time that many people plan on using there hardware. A drive that will last three years may not be able to handle the same work load for five years. To account for this, people can use a reserve buffer for the SSDs and leave twenty percent of the total TBW of each drive unused.
This will allow for a safety margin in the case that a server will experience extra writes during that five-year time period. The workloads for an array may differ from the specifications that are listed for the SSDs. Compression and deduplication will reduce the amount of data that the server writes.
However, this does not necessarily mean that the NAND drives will experience a reduction in the amount of writes. If the data is already encrypted and compressed, the SSD will write the same amount of data to the NAND drives. Additionally, hot spare drives will consume part of the total endurance of the SSD when it join the array.
The write amplification calculator can take into account the number of drives and the number of hot spares to show how many drives will be writing for the server. Another means of determining the appropriate SSDs for a given server is by referring to a table of the TBW values for SSDs. If the calculated value comes to a number that indicates that the SSDs will experience one drive write per day (DWPD) or more, then the SSDs may not be specified correctly for the work load.
For instance, if a server is to primarily be used to boot operating systems and applications, a consumer SSD may be sufficient. However, if the server will be used as a cache system for files that is accessed very often, then an SSD with more endurance is required. Additionally, if the SSD that is chosen for a server is the wrong class, then the person will incur more costs when having to replace the drive after it has failed.
By understanding how these factors relate to SSD endurance, a person can make certain that the SSD they purchase will last for as long as they would like their hardware to function.