Load Balancer Calculator
Estimate backend capacity, request rate, health check overhead, session affinity skew, active-active distribution, failover reserve, and TLS offload impact for home lab services.
⚙Load Balancer Presets
Pick a realistic reverse proxy or ingress scenario, then tune request rate, backend capacity, health checks, reserve, affinity, and TLS handling.
🖥Traffic and Capacity Inputs
Load Balancer Capacity Results
🗺Load Balancer Topology Grid
📊Profile Spec Grid
Typical reverse proxy behavior after connection tracking and logging.
Backends recover capacity when TLS work is terminated earlier.
Useful for small home lab service pools and rolling maintenance.
Fast enough for lab failover without creating much backend load.
📋Topology Capacity Reference
| Topology | Capacity Model | Best Fit | Watch Point |
|---|---|---|---|
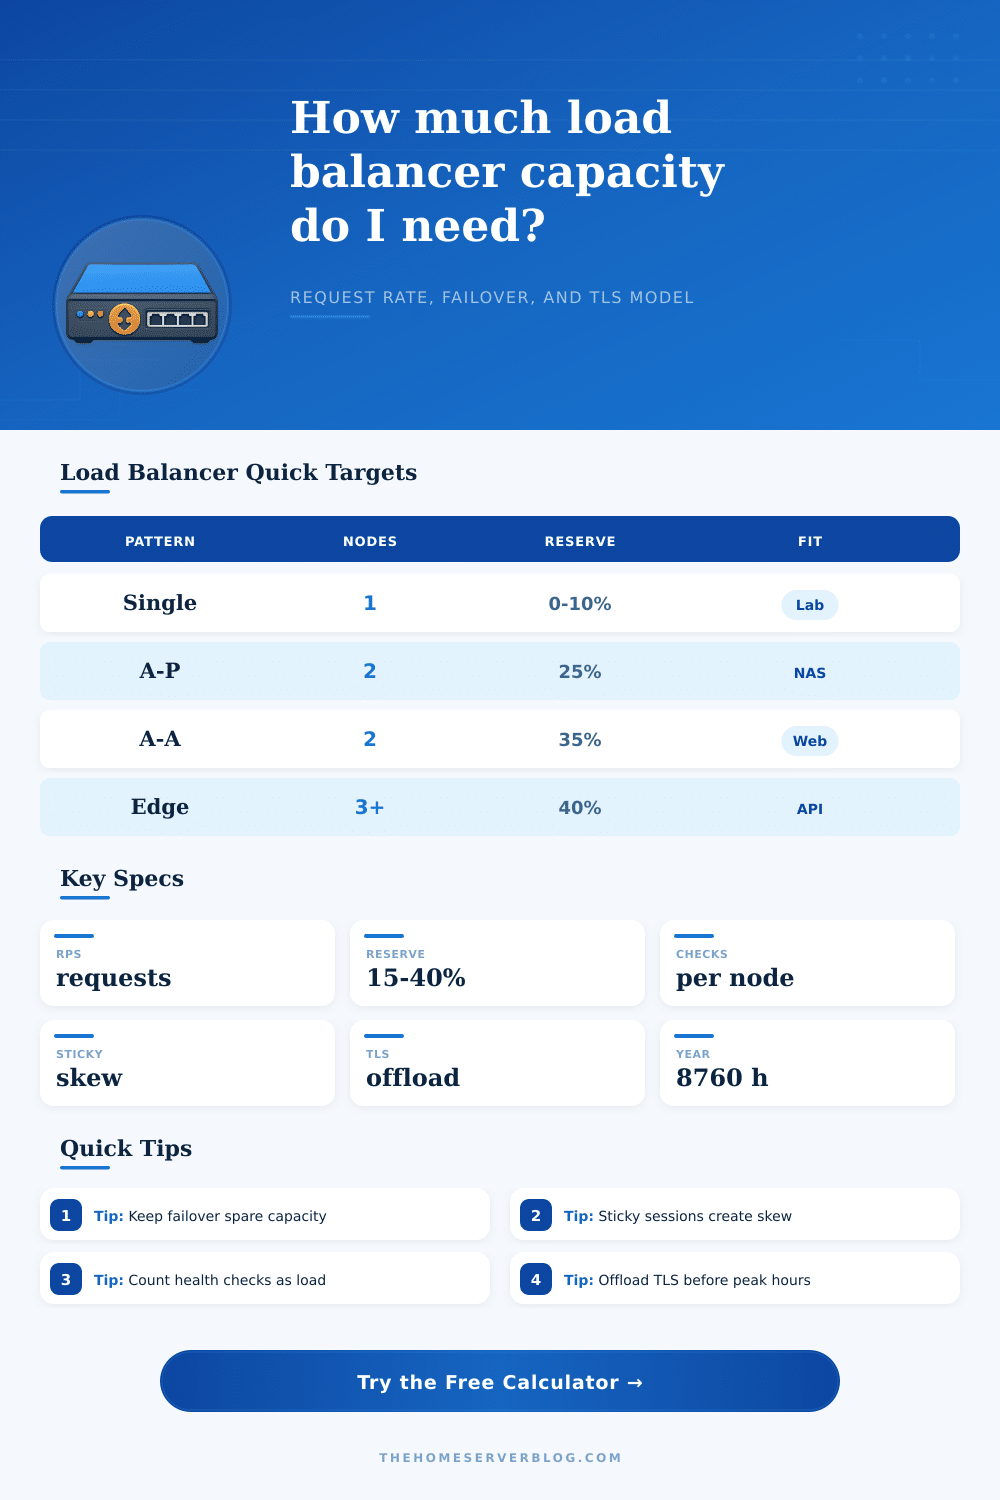
| Single load balancer | One forwarding path, no balancer reserve | Internal lab apps, dashboards, admin tools | Balancer outage takes the service down |
| Active-passive pair | One active path plus standby takeover | Firewall VIP, NAS portal, home office services | Failover delay and state synchronization |
| Active-active pair | Two paths share traffic with spare room | Web apps, cached services, stateless APIs | Uneven hashing and sticky session hot spots |
| Three-node active pool | Three balancers share traffic and updates | Kubernetes ingress and public edge services | DNS, VIP, or route convergence consistency |
| Two-site edge pair | Traffic split across locations or tunnels | Remote access and exposed home lab apps | WAN path latency and split-brain routing |
⚖Backend Capacity Table
| Backend Type | Typical RPS | Response Time | Calculator Use |
|---|---|---|---|
| Small VM web app | 75 to 150 RPS | 80 to 180 ms | Personal dashboards and light public apps |
| Container API pod | 150 to 500 RPS | 30 to 100 ms | Ingress sizing with several replicas |
| PHP or Nextcloud app | 30 to 120 RPS | 150 to 500 ms | Sticky sessions and database dependency checks |
| Static cache backend | 500 to 2000 RPS | 5 to 40 ms | Blog, docs, mirror, and asset serving |
| TCP stream service | 100 to 600 RPS | 20 to 120 ms | MQTT, game control plane, or relay traffic |
💓Health Check Overhead Table
| Backends | 5 Second Checks | 10 Second Checks | 30 Second Checks |
|---|---|---|---|
| 2 backends, cost 1 | 0.40 RPS | 0.20 RPS | 0.07 RPS |
| 4 backends, cost 1 | 0.80 RPS | 0.40 RPS | 0.13 RPS |
| 8 backends, cost 1 | 1.60 RPS | 0.80 RPS | 0.27 RPS |
| 8 backends, cost 3 | 4.80 RPS | 2.40 RPS | 0.80 RPS |
| 16 backends, cost 3 | 9.60 RPS | 4.80 RPS | 1.60 RPS |
🔒Affinity and TLS Tradeoffs
| Setting | Capacity Effect | Why It Matters | Practical Target |
|---|---|---|---|
| No session affinity | Near ideal distribution | Requests can spread evenly across healthy backends | Use for stateless APIs and cached pages |
| 25% sticky sessions | Moderate skew | Some clients keep returning to the same backend | Add 8% to 12% more spare capacity |
| 75% sticky sessions | High hot-spot risk | One backend can reach saturation before the pool average | Use consistent hashing and larger reserve |
| TLS passthrough | Backend CPU stays busy | Each backend performs handshakes and encryption | Useful when end-to-end TLS is required |
| TLS offload | Backend capacity improves | The balancer or edge handles certificate and crypto work | Confirm the balancer has enough CPU headroom |
💡Load Balancer Tips
Capacity planning is the process of determining the amount of traffic that your setup can handle before the setup itself break. People often start with the number of requests per second that your backends can take and the number of backend that you have. However, these factors does not explain the complete picture of the capacity of your service.
To get a complete picture, you must also take into account the load that health check create, the load that sticky sessions creates, and the load that TLS create. The calculator included in this article will handle the mathematics of the system once you have entered your traffic and topology patterns. Using the calculator will save you from guessing at the capacity of your system.
How to Plan Your System Capacity
Each of the factor should be understood as to how they will change the outcome of your capacity calculations. For example, you can determine that a health check that occurs every five second across eight backends will create more load than a health check that occurs every thirty seconds across two backend. This create overhead for your system, which reduces the number of requests that your system can take.
Sticky sessions can also create hot spot within your system. For example, if sticky sessions are used, a significant portion of client will attempt to reach the same backend. If seventy-five percent of all clients attempt to use the same backend, that backend will reach its capacity to handle requests, even if the average number of requests to each backend is relatively low.
Finally, failover reserve is the amount of capacity that you leave in reserve in case of the failure of one of your backend. Twenty-five percent of the capacity of your system might seem like alot to leave in reserve in case of the failure of one of your backends. However, if one of your backends go down, the remaining backends will have to handle the load of all of the clients, as well as the health check load for all of the backends that remain in operation.
The calculator models this possibility of a failure of one backend. Whenever you change the failover reserve percentage or the topology of your system to one that utilize fewer active paths, the calculator will adjust the usable capacity of the system to reflect the loss of one of the backends. The calculator does not provide a number for the capacity of your system, but provides you with an idea of whether or not your chosen number of backends will be able to survive the failure of one of those backends.
Finally, offloading TLS to your load balancer will increase the amount of capacity that your backends have to receive requests. However, offloading TLS to your load balancer will also increase the amount of CPU and connection tracking requirement that your load balancer has to meet. Hardware offload reduces the penalty on the load balancer, but passthrough mode leave the backends to perform the encryption work.
The choice of TLS offload method has an impact on the response times of the system, especially during peak traffic period. Failures in a system are rarely the result of traffic spiked to the system at one time. Instead, the failures are the result of several small factor working together at the same time.
Each factor takes a portion of the systems capacity. While each portion of the systems capacity may appear small individually, the combined portion of the systems capacity is often enough to cause the system to collapse under the combined demand. A system may pass a test for requests-per-second while the system has no other demands on it, but the system may collapse when undergoing maintenance or in the case of a partial system failure.
The calculator allows you to see each of these portion of the systems capacity so that you can make an informed decision about whether to add another backend server or changing the topology of the system. One of the most common mistake in sizing a system is to treat the capacity of the system as a fixed property of the hardware. System capacity is not a fixed property of the hardware, but a moving target.
For example, a system may size its backends to handle the average amount of traffic received, but the sticky sessions can cause all the traffic to be directed to a single backend server. Another common mistake is to ignore the impact of health checks on the systems capacity. In some instances, health checks can consume more requests from a system than the system itself recieve.
These mistakes occur because the features and factors that seem irrelevant during system setup can become critical after the system comes online. A good strategy for sizing a system is to start with the amount of traffic the system receive at peak. The peak traffic can be increased by a percentage to account for growth in the traffic that the system may receive.
The amount of traffic that the backends must handle can be increased for the overhead of the environment in which the system will be deployed. These numbers can be calculated with the systems topology and TLS mode. Once the system is sized, there is headroom and failover traffic that must be considered.
If the loss of a single backend would cause the system to drop below its reserve target, then another backend server would of been required.