Packet Per Second Calculator
Estimate Ethernet line-rate PPS, L1 overhead, duplex aggregate traffic, packet size mix, and CPU processing headroom for home lab links.
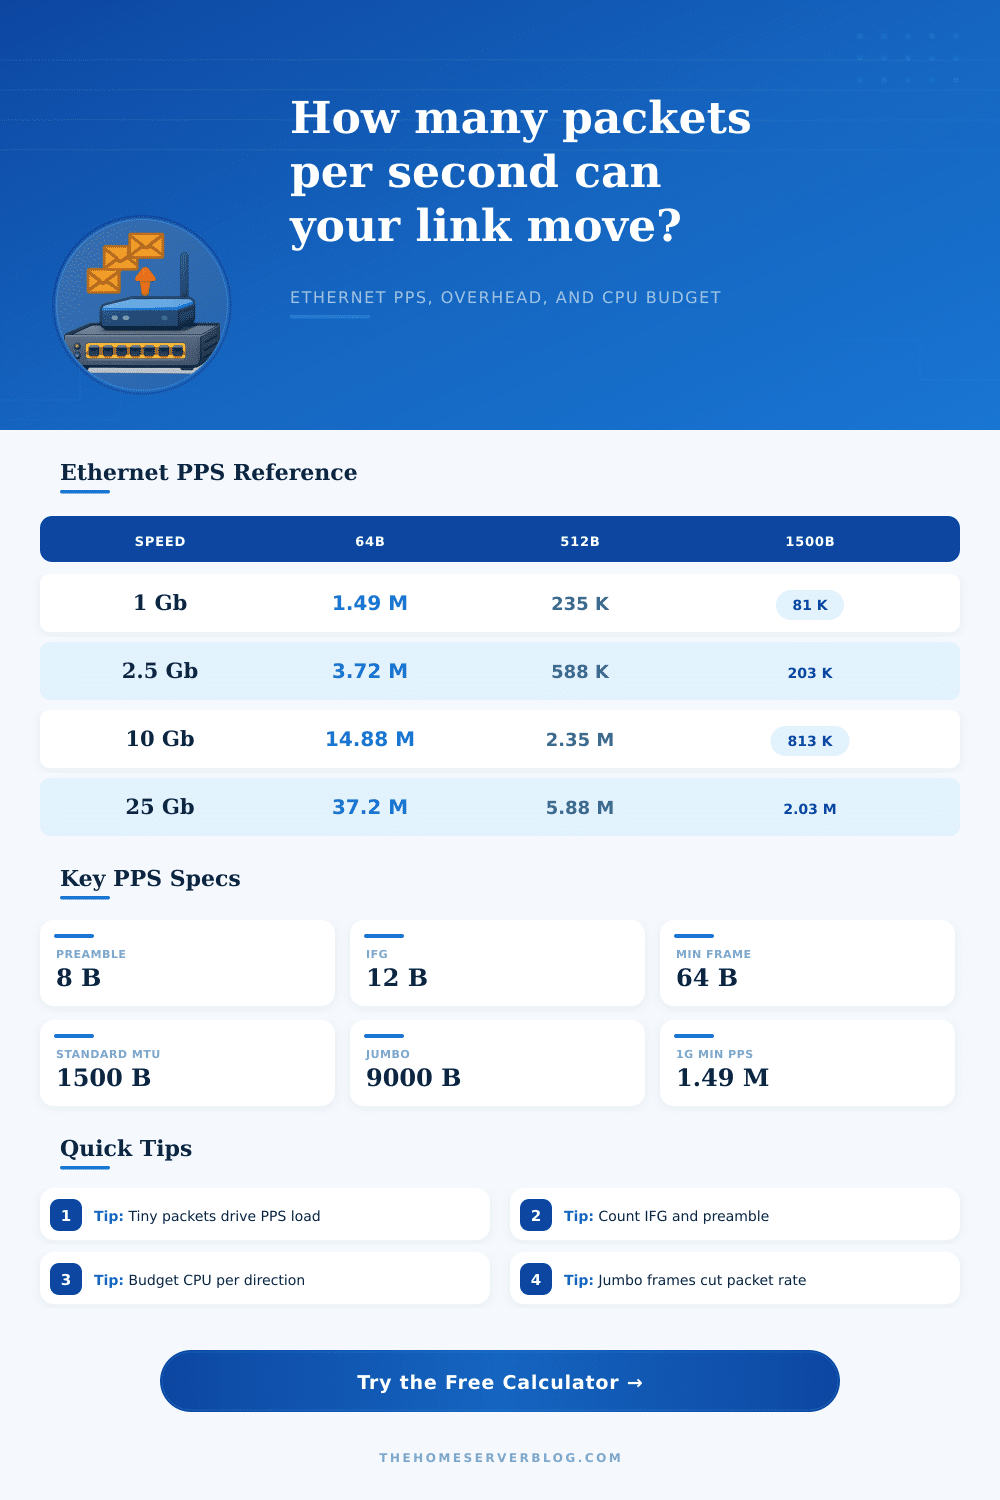
| Link speed | 64 B frame | 512 B frame | 1518 B frame | 9018 B jumbo |
|---|---|---|---|---|
| 100 Mbps | 148,810 PPS | 23,496 PPS | 8,127 PPS | 1,383 PPS |
| 1 Gbps | 1,488,095 PPS | 234,962 PPS | 81,274 PPS | 13,830 PPS |
| 2.5 Gbps | 3,720,238 PPS | 587,406 PPS | 203,186 PPS | 34,574 PPS |
| 10 Gbps | 14,880,952 PPS | 2,349,624 PPS | 812,744 PPS | 138,303 PPS |
| 25 Gbps | 37,202,381 PPS | 5,874,060 PPS | 2,031,860 PPS | 345,757 PPS |
| 100 Gbps | 148,809,524 PPS | 23,496,241 PPS | 8,127,440 PPS | 1,383,029 PPS |
| Component | Typical bytes | Included in MAC frame? | PPS impact |
|---|---|---|---|
| Minimum Ethernet MAC frame | 64 B | Yes | Highest packet rate |
| Preamble plus start frame delimiter | 8 B | No | Adds L1 wire time |
| Inter-frame gap | 12 B | No | Required idle spacing |
| 802.1Q VLAN tag | 4 B | Often counted separately | Small PPS reduction |
| Jumbo Ethernet frame | 9018 B | Yes | Much lower packet rate |
| Mix profile | Small 64 B | Medium 512 B | Large 1518 B | Jumbo 9018 B |
|---|---|---|---|---|
| Small packet routing | 80% | 15% | 5% | 0% |
| Balanced internet traffic | 45% | 35% | 20% | 0% |
| Large storage traffic | 10% | 15% | 75% | 0% |
| Jumbo frame storage | 5% | 5% | 10% | 80% |
| Device or role | Typical PPS per core | Best fit | Planning note |
|---|---|---|---|
| Low-power firewall VM | 150K to 400K | 1G to 2.5G labs | Leave margin for rules and VPN |
| Modern router VM | 500K to 1.5M | Small 10G uplinks | Depends on offload and drivers |
| IDS or packet capture | 100K to 800K | Mirror ports | Inspection can dominate CPU |
| ASIC switch forwarding | Hardware line rate | Core switching | CPU mainly handles control plane |
Maybe you know what your network speed is. Maybe you bought a gigabit router, or maybe you signed up for a one gig plan. Because that’s the raw volume of data being moved in the pipe, that number feels solid; it doesn’t take into account how it’s being packaged or procesed. But there’s more to story than just bandwidth. The other half is called packets per second, which tell you if your hardware can actualy handle all the traffic you’re sending down the wire.
Most home lab guys focuses on throughput, only to find their firewall starting to drop connections as it struggle with a simple DNS query storm. What’s the problem? Why does a link that can move terabytes of video across it without skipping a beat choke at thousands of tiny packets per second? The answer lies not in movement of bulk data but the way network handles individual frames.
Why Packets Per Second Matter More Than Speed
A single big file transfer may need very few packets, which is easy for any moddern CPU to manage. An internet traffic mix full of little things like web browsing and acknowledgements generates a huge number of unique packets. Each packet has to be inspected, queued up and decision made to forward it.
At this point it’s important to tell the difference between host processing power and L1 wire rate since Ethernet itself have a physical overhead which consumes some of your available bandwidth prior to delivering any payload to the operating system. In order to sync the receiver with each frame, Ethernet requires an eight byte preamble followed by a twelve byte inter frame gap which give the hardware time to reset. These bytes won’t be seen by vast majority of users but given that we’re talking about millions of tiny frames per second, they add up quickly. Use the calculator above to see precisely how much of your theoretical bandwidth gets consumed by these required protocol artifacts vs. This is useful data.
A one gigabit link processing minimum sixty four byte frames equate to almost one point five million packets per second. That’s a high-sounding number unless you put it into context off your own processor. If you allocate four cores for packet processing and each can only realisticly handle five hundred thousand packets per second, then you’ve got just enough headroom, but with no margin for unexpected spikes in traffic or inspection rules. Add some safety buffer there, and now you’re looking at a gigabit link that’s a bottleneck…not because the wire is full, but because your CPU is drowning in packet headers.
Total number of packets/sec also depend on the mix of framesizes used in the storage network. On the very same gigabit link, a jumbo frame storage network may be sending a small 13 thousand packets/sec, barely a load for low end hardware to handle. In contrast, a constant stream of tiny packets from a VoIP cluster or a gaming server will push packet rate up to its theoretical maximum, regardless of how little bandwidth they use. Knowing about this tradeoff can help you decide when to improve bulk transfer speed vs staying responsive under fragmented load conditions.
People also tend to forget about duplex traffic and size accordingly. In a full duplex case, the link processes both incoming and outgoing packets at the same time. This means it is effectively doubling the workload on symmetric workloads. You could of had a test that assumes one-directional only, but not realize that during peak use times, bidirectional traffic is going to be more than you can handle with your interrupt handling ability.
It’s laid out clearly in the reference table on the page. The table contrast line rates at various frame sizes and speeds, making it clear just how fast these numbers grow when going from a gigabit link to a ten gigabit one. In fact, the increase in required packets per second will often be far more punishing than the increase in bandwidth usage itself, since hardware scaling linearly in speed may not be able to keep up with resulting increase in interrupts.
In summary: If you want to build a stable connection, you’ve got to consider more than just the speed tier printed on the box. You’ve also got to understand how many packets you’ll be seeing and if your CPU can spend enough time sorting them before dropping one. First determine what your dominant traffic pattern is, see what the packet rate implication is, and then make sure you have headroom in your hardware budget (to allow for error). Real world performance is never as fast as theoretical line rate, and it’s hardly ever about bandwidth any longer; it’s almost always about packets.