Transaction Per Second Calculator
Estimate sustained TPS, peak TPS, commit pressure, retry overhead, and session capacity for app and database workloads.
TPS Estimate
OLTP web apps
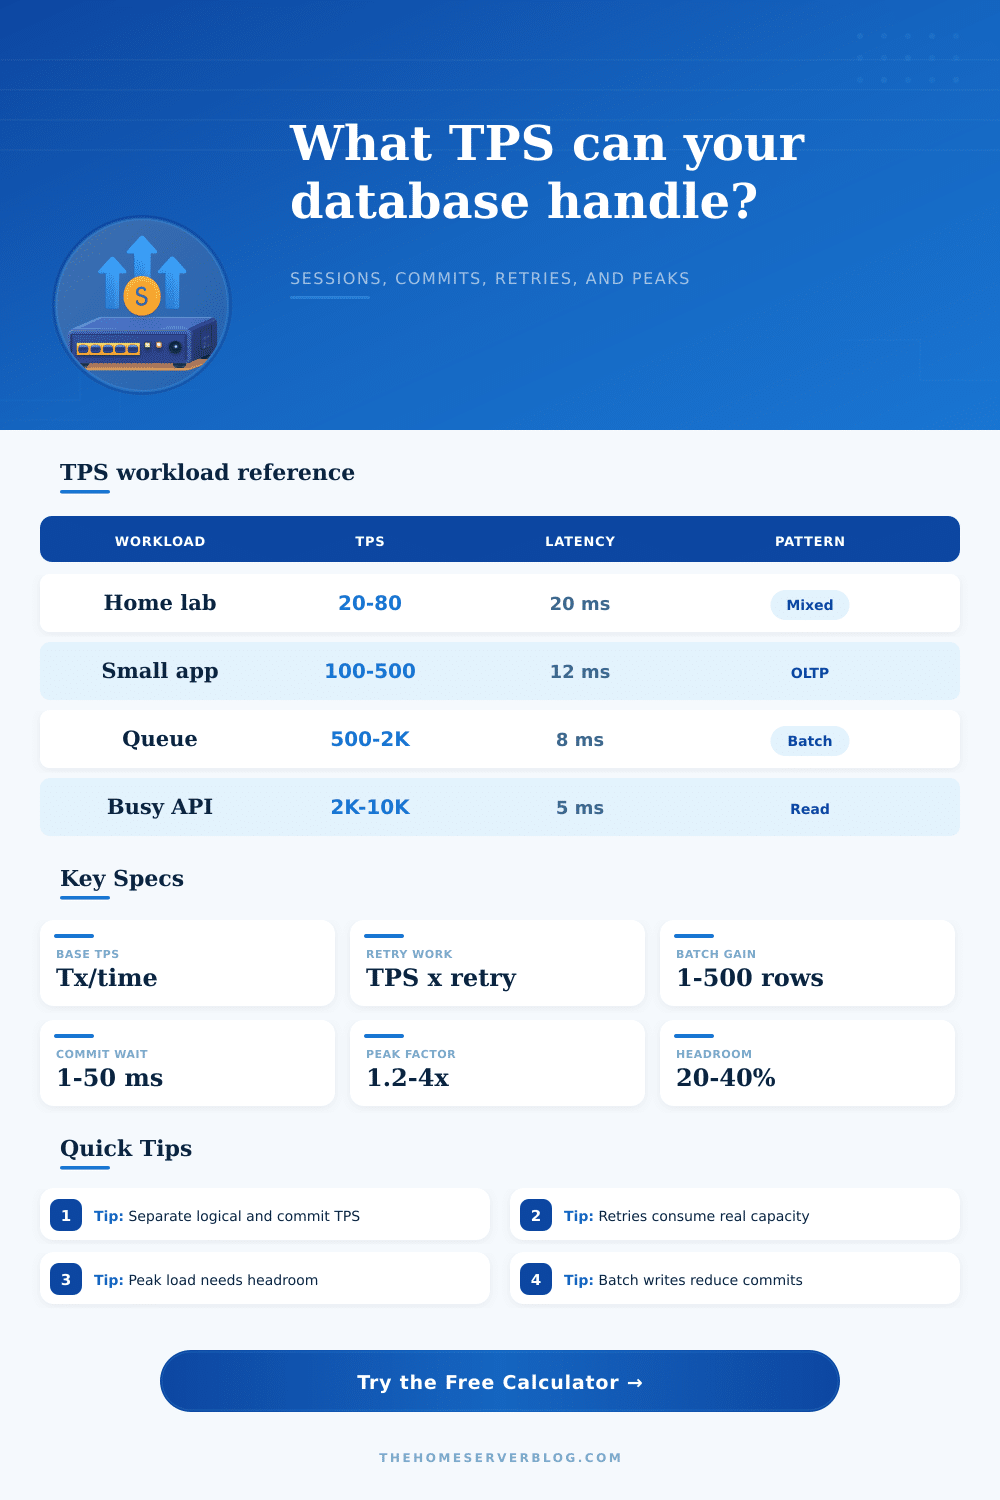
Small transactions, short locks, and many commits. Watch p95 commit latency, connection pool saturation, and retry spikes.
Queue workers
Batching improves commit throughput, but large batches increase lock duration and replay cost after worker failures.
Read-heavy APIs
Cache hits and replicas can lift logical TPS, while the primary still needs write and invalidation capacity.
Checkout flows
Expect more write pressure, uniqueness checks, inventory locks, and payment callbacks than a simple page-view workload.
Analytics ingest
Batch size dominates commit TPS. Track rows per second separately from durable commits per second.
Distributed SQL
Consensus and cross-region writes add latency. Headroom protects failover and leaseholder movement events.
| Mix | Read / Write | Typical Commit Pattern | Planning Note |
|---|---|---|---|
| Read-heavy API | 85% / 15% | Mostly read-only, light writes | Cache and replica placement affect logical TPS. |
| Balanced OLTP | 60% / 40% | Short read-write transactions | Use p95 latency if the app has tight response targets. |
| Write-heavy queue | 30% / 70% | Frequent durable writes | Batching can reduce commit pressure dramatically. |
| Checkout flow | 45% / 55% | Inventory, order, and payment writes | Conflict retries matter during flash-sale peaks. |
| Analytics batch | 20% / 80% | Bulk inserts and upserts | Track commit TPS and row throughput separately. |
| Cache-backed reads | 95% / 5% | Rare database writes | Database TPS can be far below app request rate. |
| Preset | Completed / Window | Sessions | Latency and Batch |
|---|---|---|---|
| SQLite Home App | 12,000 / 10 min | 8 | 18 ms commit, batch 1 |
| Postgres API | 180,000 / 5 min | 120 | 6 ms commit, batch 1 |
| MySQL Checkout | 95,000 / 5 min | 90 | 10 ms commit, batch 1 |
| MariaDB CMS | 60,000 / 10 min | 45 | 9 ms commit, batch 1 |
| Redis Queue | 900,000 / 5 min | 64 | 2 ms commit, batch 25 |
| MongoDB Feed | 360,000 / 5 min | 140 | 5 ms commit, batch 5 |
| SQL Server Line | 240,000 / 10 min | 160 | 7 ms commit, batch 2 |
| CockroachDB Edge | 110,000 / 5 min | 100 | 18 ms commit, batch 1 |
| Kafka Sink DB | 1,500,000 / 5 min | 80 | 4 ms commit, batch 100 |
| Analytics Batch | 2,400,000 / 15 min | 32 | 12 ms commit, batch 500 |
| Metric | Formula | What It Means | When To Watch It |
|---|---|---|---|
| Observed TPS | Completed transactions / seconds | Logical work finished by the app. | Baseline performance reports. |
| Attempt TPS | Observed TPS x (1 + retry rate) | Total database attempts including retries. | Conflict-heavy or serializable workloads. |
| Commit TPS | Attempt TPS / batch size | Durable commit operations per second. | WAL, fsync, binlog, or replica lag pressure. |
| Peak TPS | Observed TPS x peak factor | Traffic level to provision for bursts. | Daily peaks, releases, and campaigns. |
| Session capacity | Sessions / weighted latency | Upper bound from concurrency and wait time. | Connection pool and p95 latency tuning. |
| Signal | Healthy Range | Warning Pattern | Action |
|---|---|---|---|
| Retry rate | 0-2% | Over 5% sustained | Inspect locks, unique indexes, and isolation level. |
| Commit latency | 1-10 ms | Spikes during checkpoints | Check WAL device, sync settings, and replica wait. |
| Headroom | 20-40% | Less than 15% | Add capacity or lower peak fan-out. |
| Batch size | 1 for OLTP, 25+ for ingest | Huge locks or slow replay | Split batches and measure p95 response time. |
| Sessions | Pool-sized to cores | Too many active waits | Use pool limits and queue excess requests. |
Start small… Get a couple of users and it’s ok. Get a bunch of users and everything seem fast. Then at some point you go over this magical line and now your database chokes on its own writes. It’s not magic. You didn’t plan for the physical cost of retries and commits, only for logical transactions.
When you know how many writes per second you want and how long a user session last, that’s when the calculator does the math. It spares you having to guess what number of disk writes your app will create. That’s the most difficult aspect of capacity planning: understanding the difference between what your app believes it did and what was actualy written to the database.
Plan Your Database Size
Completed transactions is the metric most developer focus on, but they ignore the silent tax of retry overhead. Even though users see just one request, the database still do work when a serialization conflict or a deadlock occurs. This additional work occupies connection pool slots, consumes lock resources, and use CPU cycles. To account for this, it asks you for your retry rate. Two percent may not sound like much but that’s a lot of load on the system when throughputs gets high. You’re paying for failed attempts as well as successful ones.
Batching is another variable that has a big effect in the equation. When you commit each row individually, you pay dearly with write-ahead log entries and fsync operations. Committing hundreds of rows at once cut down on that overhead substantialy. But bigger batches also mean those rows are held in lock for longer amounts of time. That makes it more likely that concurrent sessions will attempts to access same data, resulting in a conflict.
You’ll notice the calculator distinguishes between logical transactions and commit transactions to help illustrate this tradeoff. Use it to determine whether your batch size is truly improving concurrency or not.
Usually the bottleneck isn’t the CPU (it’s the connection pool). You can crank out ten thousand requests a second with your app, but if you can only handle fifty at once all those other requests get queued. That number above (session capacity) represent how much your current concurrency config limits throughput, assuming an average latency. When your response time goes up, your effective throughput go down. Unless, of course, you increase the number of connections.
And that’s why it’s important to monitor p95 latency rather than average out everything. Slow requests pile up at the end and clog pool faster than a steady, average performance. Average is not the same as peak. Traffic can spike 3-4x during your busiest times. This happens when people check email in the mornings, when a new product launches and everyone logs in, or during holiday sales. If you plan for average, you’ll fail during this period.
To handle these traffic spikes, you require some amount of “headroom“… The ability to absorb sudden increases in demand without sacrificing service quality. Use the calculator to specify how much reserve capacity (and headroom) you’d like to allocate for background work such as checkpointing or vacuuming. Such maintenance tasks uses the same I/O resources as your user queries. They will cause unpredictable latency spikes if neglected, and they will be hard to debug afterwards.
Not all workloads should be tuned the same way. For example, a read-heavy API generaly scales well with additional read-only replicas being added to spread most of the load off the main node(s). Conversely, write-heavy queues has stronger durability and consistency requirements, so you’re simply stuck with higher commit latencies. One set of settings does not fit all when it comes to database engines. A relational checkout flow isn’t the same as a Redis queue. Knowing what percentage of your traffic is write vs. Read will inform your decision regarding tool presets.
We’re not trying to push as much through here as we can. We’re trying to keep it steady with the load you’re seeing in real life. If you over provision, you waste money. Under provision, you lose your reputation. When you combine peak factors, commit pressure, and retry overhead into one view, you see the total health of the system. That shifts the discussion from raw numbers toward an architecture that works. Because you considered the areas of friction instead of pretending they didn’t exist, you end up building something that lasts. And the calculator will show you where to find that sweet spot before the traffic spikes roll in.