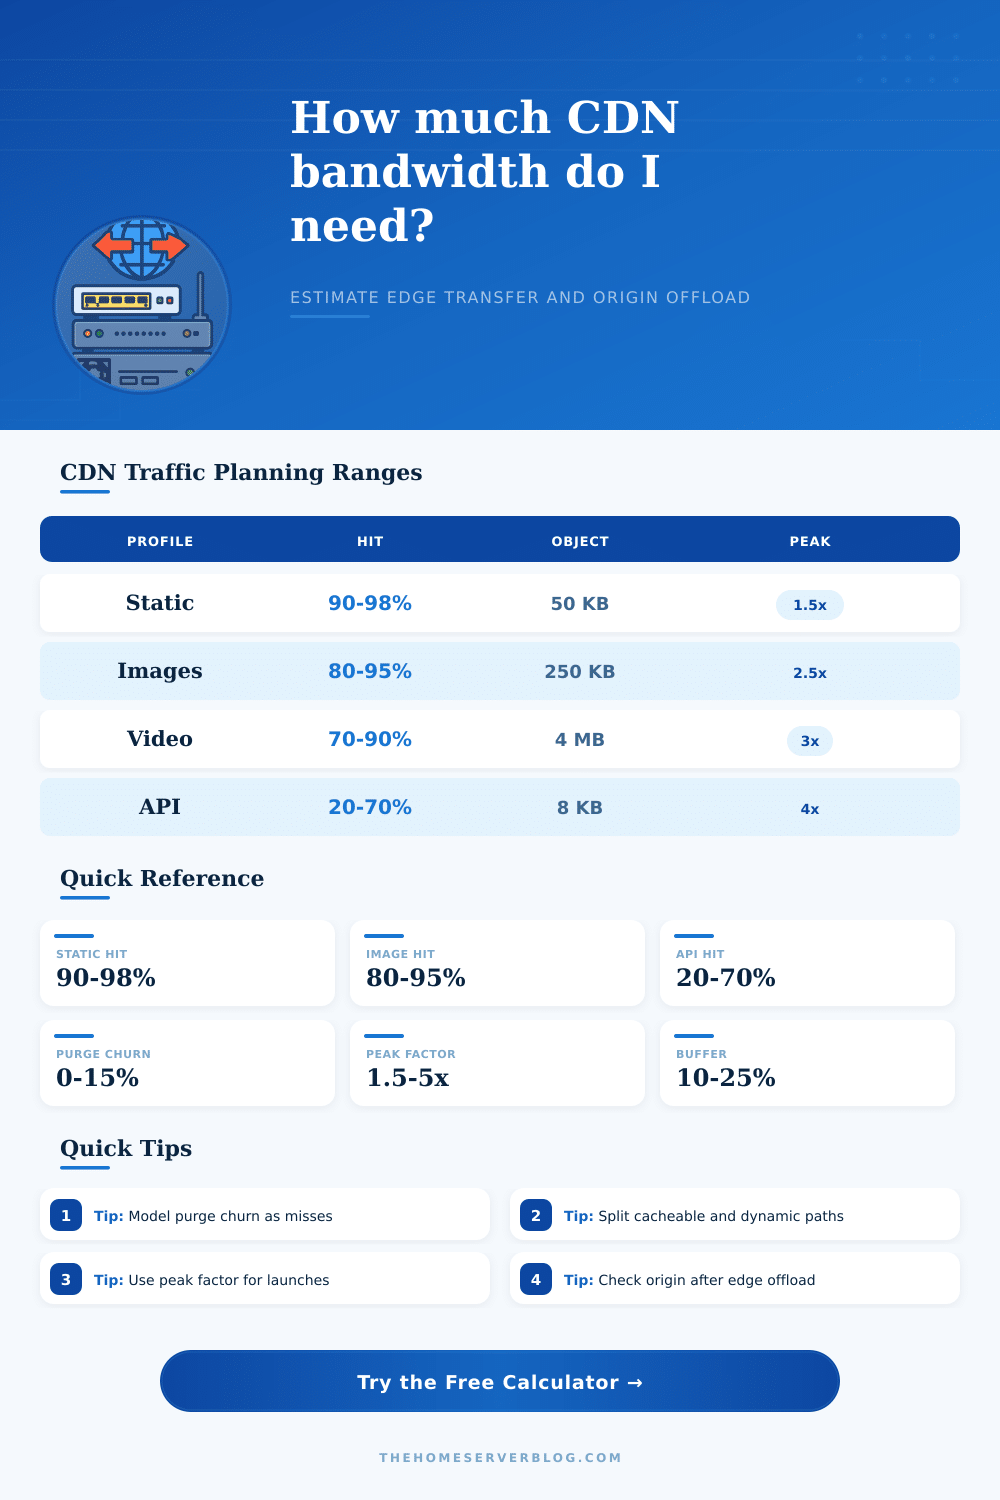
CDN Bandwidth Calculator
Estimate monthly CDN edge transfer, origin pull traffic, cache savings, purge churn, regional distribution, and peak serving rate.
⚡CDN traffic presets
📊Traffic inputs
CDN bandwidth estimate
🧮CDN traffic component grid
💻CDN profile reference
📘Cache behavior table
| Traffic type | Common object size | Typical cache hit | Origin planning note |
|---|---|---|---|
| Static pages, CSS, JS | 20 KB to 300 KB | 90% to 98% | Best offload when filenames are versioned. |
| Responsive images | 80 KB to 700 KB | 80% to 95% | High transfer savings with stable cache keys. |
| Downloads and packages | 5 MB to 2 GB | 70% to 95% | Few misses can still create large origin pulls. |
| API JSON and fragments | 1 KB to 50 KB | 20% to 70% | Short TTL and auth headers reduce hit ratio. |
🌐Regional split table
| Audience pattern | Largest region | Peak concentration | When to use |
|---|---|---|---|
| Single region audience | 80% | 1.25x | Local site or app with one primary market. |
| North America and Europe | 55% | 1.10x | Two-region readership with staggered busy hours. |
| Balanced global audience | 40% | 1.00x | Traffic spreads across many edge locations. |
| Launch spike in one region | 90% | 1.40x | Announcements, patches, or timed events. |
📈Common CDN project sizes
| Project | Requests per month | Average object | Primary planning focus |
|---|---|---|---|
| Personal static site | 100k to 1M | 50 KB to 200 KB | Keep hit ratio high with long TTLs. |
| Image-heavy portfolio | 1M to 8M | 200 KB to 700 KB | Use variants and stable image URLs. |
| Release mirror | 50k to 600k | 25 MB to 500 MB | Watch cold-cache origin spikes. |
| Cacheable API edge | 10M to 200M | 2 KB to 30 KB | Separate public cache from private responses. |
⚙Formula breakdown table
| Component | Formula | Input used | Result meaning |
|---|---|---|---|
| Raw transfer | Requests × object size | Monthly requests, object size | Total data if every object came from origin. |
| Effective hit | Hit ratio reduced by purge churn | Cache hit, purge rate | How much CDN-routed traffic is served at edge. |
| Origin pull | CDN traffic × cache miss | Edge offload, effective hit | Traffic your origin must send to edge caches. |
| Peak rate | Average day × peak and region factor | Peak multiplier, regional split | Estimated burst serving rate at the edge. |
You don’t notice how fast your first mention on social media drive traffic to your personal website. You notice when the bill comes due. You notice when your server give up trying to respond because it’s dead-silent. That’s the classic moment of growth pain for any content creator. Traffic doesn’t arrive as a stream; it arrives in waves. Static averages lie to you about what happens in those waves. Looking at shape of demand will help you understand how much bandwidth you actualy need. It is less about how much data moves in a year and more about how fast it try to move in an hour.
Guessing at cache hit ratio is where most folks begin. “I have a bunch of static images/CSS,” they reason, “so I’ll get perfect cache.” The reality is this. Cache gets killed off by frequent deployments. Each time you deploy an updated file and purge the previous version from your edge network, you create ripple effect of misses. These flow back to your origin server, creating load just when you would of thought things would ease up.
Why Your Website Needs More Than Average Bandwidth
Plugging your own purge rate into the calculator above does all this math for you… It helps you avoid the risk of under-estimating that specific bit of infrastructure strain. It requires you to deal with the churning effect instead of sweeping it aside until deployment day arrives.
The second problem is peak demand. The average number of transfers per month are reassuring, it evens out those busy weekend days with those quiet nights. But average isn’t what hardware cares about. Hardware care about spikes. A sudden flood of interest for your site mean that you’ll have to deliver that traffic all at once, which can blow away the monthly average by a factor of three or more. Make sure you estimate that peak rate so you know you’re getting a connection (or a CDN tier) that can accommodates that burst without falling over or getting throttled back.
This is where regional distribution comes into play: if all your users are on the same time zone, everybody wants the content at the same time. If they’re spread around the globe, then that load naturaly flattens out.
And that’s where serving object sizes comes in. How you think about bandwidth vs. Storage depends entirely on what size objects you’re serving. Ten thousand downloads of a two-hundred-megabyte game patch is not the same than a million requests for tiny json api responses. It’s eating up your data cap immediately, whereas it’s stressing out your CPU and database. You can’t handle both the same way. To lay that out, page has a reference table that shows how wildly its hit ratio varies based off what kind of thing you’re serving: text, images, video. Dynamic API responses may only manage to keep a third of their cache, whereas static assets can reach upwards of ninety percent caching effectiveness. If you know what bucket your traffic fits in then you can make realistic expectations about how much origin offload you will get.
Too many developers view a CDN as a speedier hard drive. A CDN is also a filter. Its main task is to prevent any traffic from being sent to your origin server at all. If 95% of traffic can be served from the edge, then your origin sees just 5%. Of course this requires routing the correct traffic along the CDN path and setting the cache rules properly. Content that should be cached, but which has direct connections available, doesn’t help. This gets you neither the benefits of caching nor the savings of reduced bandwidth (and the cost of server capacity too).
Lastly, remember that complexity doesn’t scale linearly with cost. If you add things like an aggressive cache purge policy, high peak multipliers, and global distribution, then those all needs more resources added at a rate greater than just a plain static site. The question is how do you balance the need to serve fresh content against the cost of serving it? Trying to keep content fresh leads to misses. Misses mean origin load. Origin load means money or broken servers.
Planning for CDN bandwidth is about managing risk. It’s about figuring out what amount of traffic you’ll just let sit on the line, and what you’ll need to serve yourself. It’s not about creating a system so robust it protects against all conceivable worst cases, rather, it’s about creating a system capable of absorbing the expected surges without collapsing. And once you know what peak rate vs. Monthly transfer looks like, you no longer guess. Instead, you begin constructing systems that breathe alongside your audience, rather than choke when they appears.