SQL Table Size Calculator
Estimate table data pages, row overhead, variable columns, index storage, fill factor impact, compression savings, LOB data, retention, and monthly growth for SQL Server, PostgreSQL, or MySQL planning.
Fixed bytes, variable bytes, null bitmap, row header, and slot overhead.
Leaf pages needed after page header, fill factor, and compression.
Secondary index leaf entries plus internal B-tree page overhead.
Off-row text, blob, json, xml, images, or document payload estimates.
| Component | Current size | Per row | Monthly growth | Projected size |
|---|---|---|---|---|
| Run the calculator to view storage components. | ||||
| Engine profile | Default page | Row overhead modeled | Index entry note |
|---|---|---|---|
| SQL Server rowstore | 8 KB | 7 byte row header plus null and variable offsets | Nonclustered leaf stores key, locator, includes |
| PostgreSQL heap | 8 KB | Tuple header, line pointer, and alignment padding | B-tree leaf entry includes key and tuple identifier |
| MySQL InnoDB | 16 KB common | Record header, transaction fields, and page directory | Secondary indexes include primary key columns |
| Generic SQL estimate | 4 KB to 32 KB | Modeled from selected page size and row layout | Use measured DMVs for final production numbers |
| Preset | Typical rows | Storage pressure | Index pattern |
|---|---|---|---|
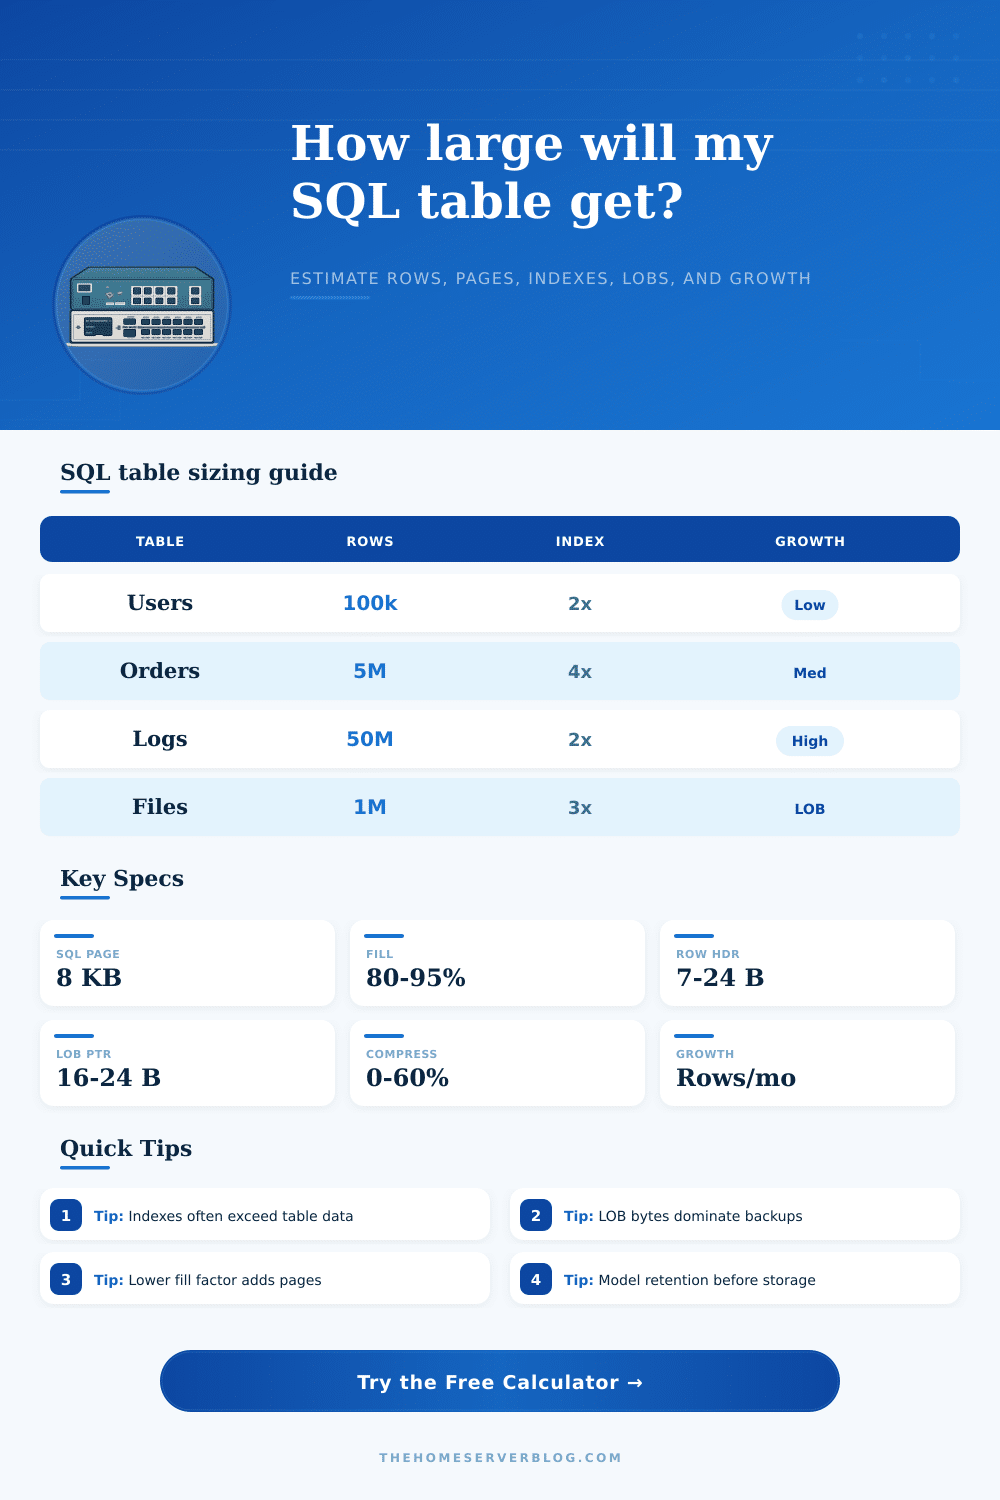
| User accounts | 100k to 2M | Moderate varchar and login metadata | Primary key, email, status, tenant |
| Order history | 1M to 50M | Wide rows with durable indexes | Customer, date, state, invoice |
| Audit log | 10M to 500M | Fast append growth and retention risk | Timestamp, actor, entity, event |
| IoT telemetry | 50M to billions | Narrow rows but very high growth | Device, time, metric, partition key |
| File metadata | 500k to 20M | LOB payload and path text dominate | Owner, hash, folder, modified date |
| Planning item | Calculator treatment | Storage impact | Practical check |
|---|---|---|---|
| Fill factor | Reduces usable bytes per page | Lower values increase page count | Use lower fill for hot random inserts |
| Compression | Shrinks row payload before page packing | Can reduce data and index pages | Measure CPU cost on write-heavy tables |
| LOB data | Stores average payload for selected row share | Often dominates backup and replication size | Separate hot rows from cold payloads when possible |
| Secondary indexes | Multiplies key, include, and locator bytes | Can exceed base table size | Drop overlapping indexes before scaling writes |
| Growth rows | Projects rows over retention months | Forecasts capacity and maintenance windows | Partition large time-series tables early |
When you’re starting a project you have some test data, maybe a little bit of optimism. Things seem doable. And then production hits. And suddenly you are staring at a storage bill that looks more like a mortgage payment than an operational expense. Your bill becomes more like a mortgage payment than a line item for operations. Database architects struggles because we’re so far from our initial set of assumptions about what will happen when the app go live.
Many believe that we must be able to predict how many rows there will be three years into the future. Instead all you have to know is how much it cost per byte once it’s on disk with its headers, its indexes and everything else. To do that it reveals the cost of storing things, which will help you close that gap.
How to Calculate Real Database Storage Costs
Bytes in varchar columns aren’t sufficient; there’s also overhead from variable-length offset arrays, row headers, null bitmaps, etc. They’re fixed costs per row. If you’ve got lots of nullable column on a wide table, then this add up. The calculator allows you to specify all this detail and will tell you what the real average row size is. That isn’t just total width of your columns.
Total storage requirements includes indexes as well. Developers tend to create an index for each potential path through their queries which is why most estimates falls flat. An index itself is its own B-tree structure that take up space on pages. So if you’ve got 4 non-clustered indexes, you’re not actualy storing one copy of your data. You’re storing something like five or six different versions in multiple formats.
The calculator accounts for this by allowing you to specify the average width of keys in index and how many secondary indexes there is. A red flag here is when the sum of the indexes exceed the base table. That means your backups will take longer and your write performance will be bad. There’s some relief from this via compression, but it’s no cure-all.
In the real world, pages can be reduced 30-40% with repeating patterns. But this come at the expense of using more CPU time for less disk space. Aggressive compression could of saved a bunch of megabytes while slowing down insert operations until the CPU hits its limit on complex joins. Fortunately, you get to play around with various profiles to see what fits best for your situation, balancing the space savings against compute cost.
Also, because LOB (large object) data violates the usual rules for packing pages, things like images and other JSON blobs goes off into their own extents (often separate files). Left unchecked, they’ll overwhelm your backup size. Another lever is the fill factor. This is an abstract concept until you see it in number form. If you set the fill factor to ninety percent then there’s ten percent empty space on every page. That doesn’t sound very good. But it avoids splitting pages when doing high-volume inserts and thus avoids having the database engine shuffle around half a page of data when inserting a single new row. That extra space bloats up your page count (the calculator tells you by how much). Is it worth the cost of the additional disk capacity?
For retention planning, make the forecast dynamic instead of static. Most teams is planning for today and praying that the budget will cover the cost of tomorrow. Set a retention horizon and a month-over-month growth rate and it shows you what direction your storage curve are heading over time (e.g. 6 months vs. This covers a period of 2 years. It tells you if you’ll run out of space and have to archive some records or partition your data so the active filegroup doesn’t get clogged up with old stuff.
The tool comes pre-loaded with a few reference tables which provide baseline presets for typical patterns such as telemetry streams or audit logs. They tend to grow more rapidy than normal transactional data. The point of storage planning isn’t predicting the future, but knowing what levers to pull. Compression settings and index designs can make huge differences in storage footprint; small tweaks matter. There’s no crystal ball required here. Just recognize that there are invisible bytes lurking alongside your data, and take them into account. Use the presets as a starting point, tune it for the real-world width of your schema, and let the numbers show you which parts is most vulnerable. Then you’ll be able to optimize with purpose, instead of panic.