Requests Per Second Calculator
Estimate user-driven RPS, endpoint mix, cache offload, peak load, error budget, and whether your home server or small cluster has enough serving capacity.
| Endpoint | Mix % | Requests / Action | Avg CPU ms | Cacheable | Backend Cost |
|---|---|---|---|---|---|
| Traffic Type | Typical RPS | Planning Note | Watch Metric |
|---|---|---|---|
| Personal static site | 1–25 | Cache usually handles most hits | CDN hit rate |
| Busy WordPress or blog | 20–300 | PHP and database dominate misses | p95 latency |
| Small API service | 50–1000 | Endpoint mix matters more than users | CPU time |
| Launch or event traffic | 500+ | Peak factor and queue depth decide safety | 5xx rate |
| Cache Hit Rate | Origin Miss Rate | Backend Impact | Good For |
|---|---|---|---|
| 20% | 80% | Small relief | Dynamic APIs |
| 50% | 50% | Half cacheable RPS removed | Mixed apps |
| 80% | 20% | Large origin reduction | Blogs and docs |
| 95% | 5% | Origin mostly protected | Static assets |
| Server Profile | Example Capacity | Best Use | Limit To Check |
|---|---|---|---|
| Tiny VPS or Pi | 25–150 RPS | Static proxy, small apps | CPU steal or thermal |
| NAS container | 80–350 RPS | Family apps, dashboards | Disk and database waits |
| Mini PC app host | 250–1200 RPS | Reverse proxy and APIs | p95 latency |
| Small cluster | 1000+ RPS | Replica scaling | Shared database |
| SLO Target | Error Budget | Per 1M Requests | Use Case |
|---|---|---|---|
| 99% | 1.00% | 10,000 failed | Internal lab tools |
| 99.5% | 0.50% | 5,000 failed | Family services |
| 99.9% | 0.10% | 1,000 failed | Public apps |
| 99.95% | 0.05% | 500 failed | Critical APIs |
Deploying a little home server, you’re sure it will take the strain, then your buddy shares your link. It doesn’t crash instantly, though; instead, the site just stalls because page views stops for five seconds at a time. A backlog of database connections clog up until they time out. You didn’t anticipate nature of the traffic, merely how many users.
That’s where nearly all capacity planning go wrong: People count heads rather than requests. That’s where this tool comes in (above), helping you bridge that gap between simultaneous user to real-world server strain.
Why Counting Requests Matters More Than Counting Users
The math begins simply enough. It multiplies number of concurrent users by response latency times think time. However, what really matters is breaking down those actions across various endpoint.
That page view isn’t just a single request. It is an HTML document, plus perhaps three calls to APIs for dynamic data, plus multiple calls for images or stylesheets as static asset. All of these hit your server differently. Some are fast and cheap, while others is heavy, taking up CPU cycles through database queries and slowing down every other person who has to wait their turn in line.
But why? Because knowing your endpoints’ mix are important. Modeling your load as one average will blind you to your bottlenecks. You can split out your backend-heavy operations from your cacheable content. Set a very high cache hit ratio on your static assets or on cached HTML pages; those never hit your app server at all. They’re served by either your CDN’s edge node or by your proxy before they hits your database. And this is where the massive offload comes into play: It’s the difference between your servers humming along versus sweating under load.
Check out the reference tables on the page; this kind of relief, in terms of cache rates, can shave hundreds of requests off your backend count during busy periods.
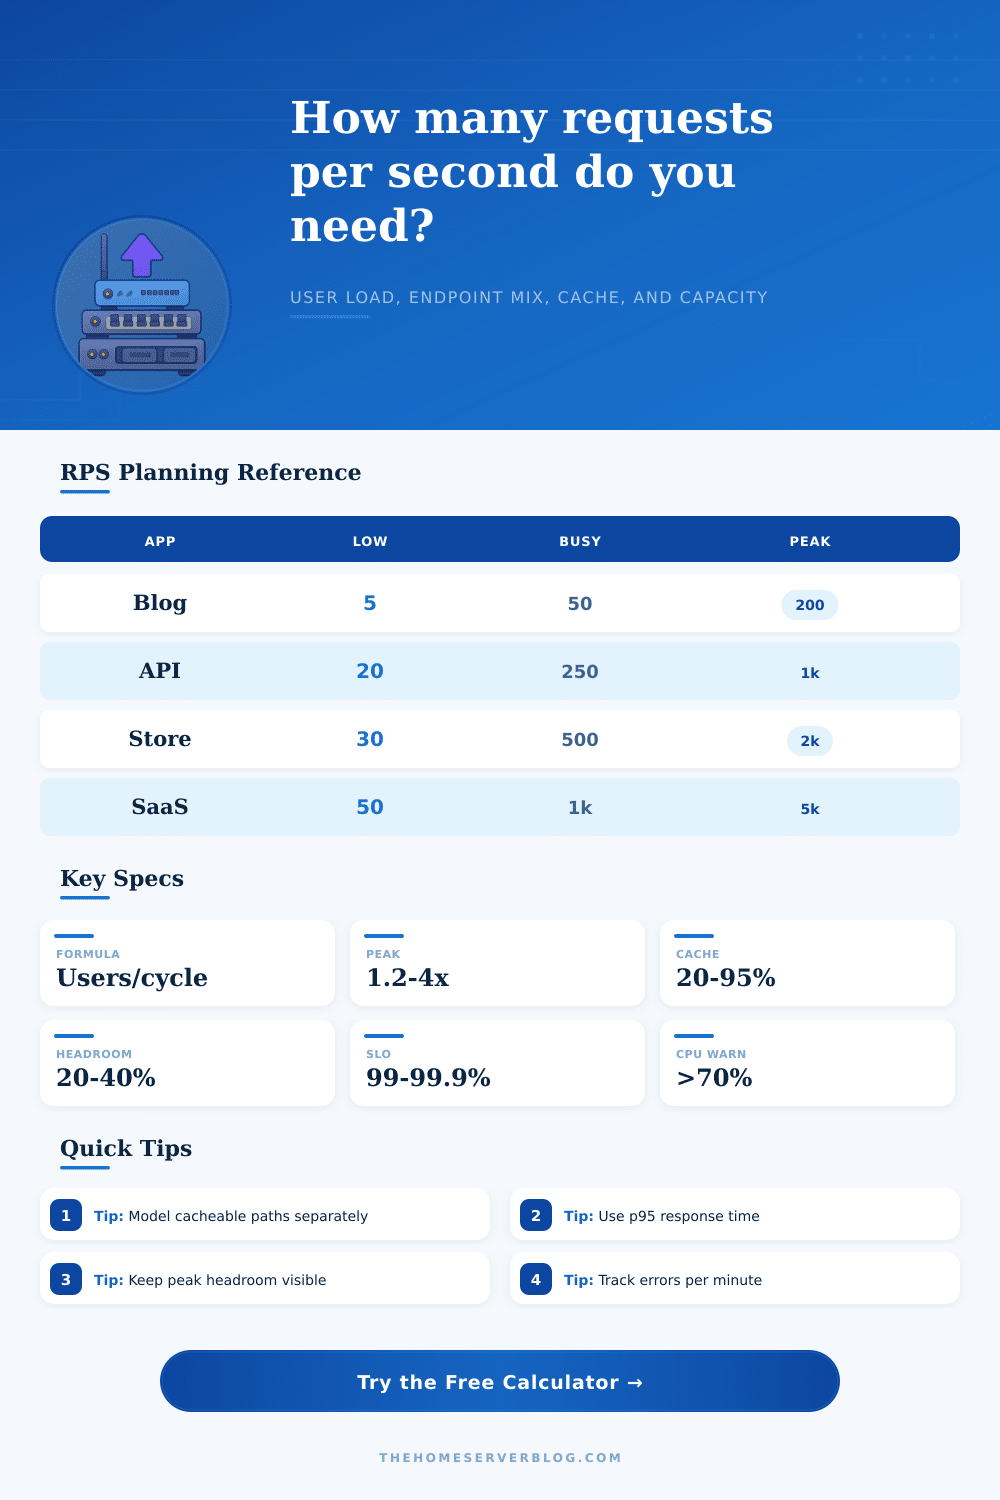
Next, you should of consider the peaks. That’s right, the very same traffic that’s 20 percent of your daily load is much less likely to be at its peak levels. Traffic is not flat. Traffic is spikes.) A single tweet from someone with an audience can make your baseline load double, triple or quadruple. Maybe it’s a scheduled deployment. Or maybe it’s just the morning rush.
Whatever it is, the tool lets you apply a peak factor to those steady-state numbers to show how a spike in load would affect you. If you don’t include the multiplier, you’ll design for a quiet Tuesday afternoon and freak out when it’s a busy Saturday evening. Better to err on the side of more than underestimate how bursty humans are.
Capacity headroom is another non-negotiable buffer. On paper 100% used servers still don’t do as well in practice, due to garbage collection pauses, background tasks, and database locks all fighting over resources. Having some breathing room by reserving twenty to forty percent of your capacity makes sure you can handle unexpected load. You know that you’re too close to the edge when you start seeing more than seventy percent cpu usage under normal conditions.
And lastly, think about your error budget. One in a thousand seems like a decent success rate; but that’s only 99.9%. That means if you have a public API, maybe that’s not okay; if you’re building an internal dashboard, maybe that’s totally acceptable. And the calculator will turn that success rate into real numbers: How many errors do you get to make each minute? Where does running over your Service Level Objective stop being something abstract and become something operational?
Capacity planning isn’t purchasing the largest machine possible. Capacity planning is knowing the rhythm of your application and creating a little extra space in the system for the crazy to fill. When you model requests instead of users, that’s when things clear up. That’s when you learn where the build up happens and how to release it before it becomes an issue.