Deduplication Ratio to Percentage Calculator
Convert a storage dedupe ratio such as 4:1 into saved percent, stored size, effective capacity, and logical vs physical usage with metadata overhead.
Logical vs physical breakdown
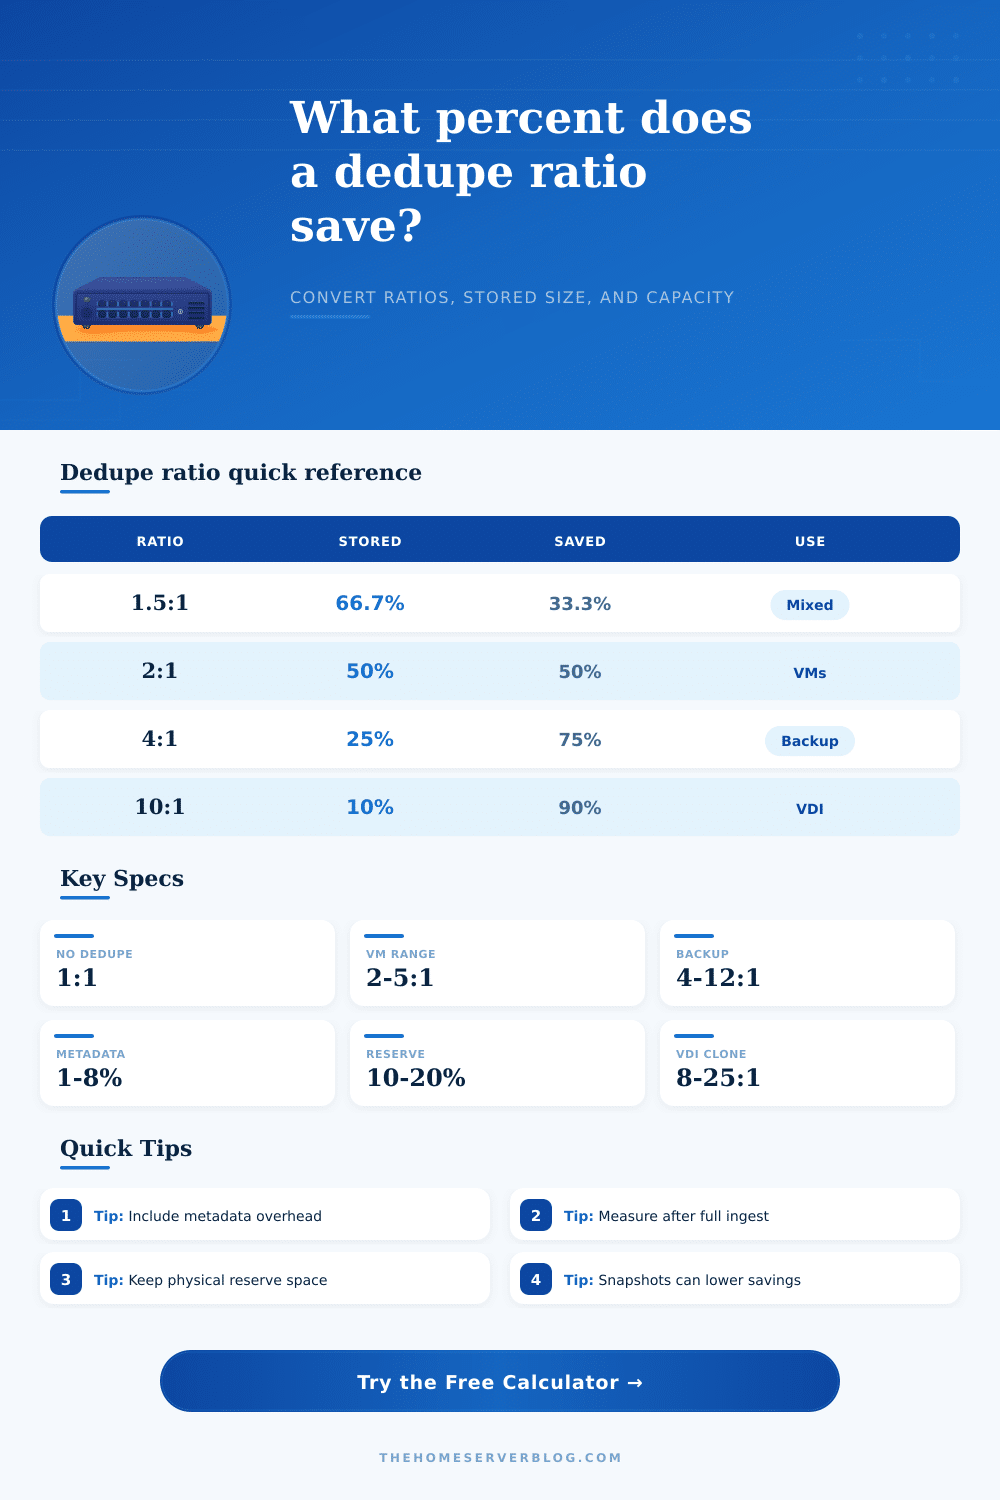
Savings percent equals 100 × (1 - 1 / ratio). Metadata overhead lowers the net effective savings.
| Ratio | Stored Share | Saved Percent | Interpretation |
|---|---|---|---|
| 1:1 | 100.0% | 0.0% | No dedupe benefit |
| 1.5:1 | 66.7% | 33.3% | Light repetition |
| 2:1 | 50.0% | 50.0% | Common VM baseline |
| 4:1 | 25.0% | 75.0% | Strong backup dedupe |
| 8:1 | 12.5% | 87.5% | Highly repeated data |
| 20:1 | 5.0% | 95.0% | Clone-heavy dataset |
| Workload | Typical Ratio | Metadata | Planning Note |
|---|---|---|---|
| Media files | 1.0-1.2:1 | 1-3% | Already compressed |
| Mixed NAS | 1.2-2.0:1 | 2-5% | Varies by file type |
| VM images | 2.0-5.0:1 | 3-7% | OS blocks repeat |
| Backups | 4.0-12:1 | 4-8% | Chains repeat blocks |
| VDI clones | 8.0-25:1 | 5-10% | Mostly identical images |
| Overhead Item | Range | Affects | Why It Matters |
|---|---|---|---|
| Fingerprint index | 1-4% | Stored size | Tracks matching blocks |
| Refcount maps | 1-3% | Metadata | Tracks shared extents |
| Snapshots | 0-20% | Physical use | Keeps old blocks alive |
| Free reserve | 10-20% | Usable pool | Protects performance |
| Small files | 1-8% | Efficiency | Raises metadata density |
| Project Size | Logical Data | Good Ratio | Stored Estimate |
|---|---|---|---|
| Small NAS | 12 TB | 1.4:1 | 8.6 TB plus overhead |
| VM host | 30 TB | 3.0:1 | 10 TB plus overhead |
| Backup box | 100 TB | 6.0:1 | 16.7 TB plus overhead |
| Lab VDI | 80 TB | 12:1 | 6.7 TB plus overhead |
| Archive tier | 200 TB | 1.2:1 | 166.7 TB plus overhead |
Need more capacity? You buy a big hard drive because it has more space and you don’t want to pay for empty storage. When you turn on deduplication features, your usable capacity decreases immediatly, even though the marketing box says it’s got forty terabytes. That decrease isn’t a bug; it’s the price of efficient data.
Instead of relying off the glossy ratios vendors love to quote, the calculator lets you know the price in real terms. The calculator lets you know the price in real terms. Understanding the difference between effective capacity and raw savings make you think different about buying storage.
The Real Cost of Saving Storage Space
That sounds great! Four-to-one, right? But all that means is that twenty-five percent of your data actualy gets written to NAND cells or the platters. Yes, that’s saving seventy-five percent. But to achieve this you has to write some metadata. You have to maintain an index of fingerprints for each unique block. And you need to count references to each extent that’s shared.
This overhead nibbles at your savings. If your metadata take up five percent of what you’re storing, then you end up with something that looks like this: You don’t get a full forty terabytes from a ten-terabyte pool. You get a little bit less. Projects fail because people plan based on the ratio but forget about the tax.
To account for that, the tool allow you to specify the percentage of metadata overhead on top of whatever deduplication goal you’ve set. That’s particularly important if you have backup repository or other virtualized environments with millions of small block that need to be tracked. With a VM image, you may have dozens of copies sharing base OS files, which can mean a very high ratio. But you also need disk space and memory for lookup table to track all those shares. It’s not a huge deal; you pay that price up front but it adds up over time as your dataset scales. If you don’t take that into account, you’ll get surprised by capacity alerts when they’re weeks earlier then expected.
The inputs that count most vary by workload type. For media, you are already working with compressed image and video file, so the extra data has been removed first, which makes deduplication difficult. You’ll get something like 1.2:1, just about no reduction whatsoever. But for workloads like VDI clones and database logs, where the same block of data gets repeated forever, you could easily gets to 10:1 (or better). That’s why the tool provides a table of references that explain what to expect. If you match your workload to realistic ratios, you won’t underestimate how much storage you need or overprovision.
Another important input that is frequently missed is how much space you are reserving. Garbage collection requires some space to rewrite blocks; don’t dedicate a deduplicated pool to 100 percent physical fullness. If you do, you’ll halt writes and potentially corrupt the integrity map as well. Snapshots will also use up space if you change data once it’s taken a point-in-time copy. Standard practice is to keep around a fifteen to twenty percent reserve in a pool. This may sound wasteful, but it ensures performance remains stable during high ingestion.
We project logical capacity based off this reserve so you have a true limit for growth. Because data grows, so does your backup window, which is another way that growth forecasting brings added real-world sense. The number of VMs increases; you plan ahead for what will be needed next year instead of running out of storage halfway through your project. You put in an estimate of percent growth and it recalculates the effective capacity. This turns hard numbers for hardware into flexible planning resources.
Instead of asking “How many terabytes will this hold?”, you ask: “How far will my investment last? Ultimately, deduplication is just a function of space vs. Complexity means that more density leads to less raw availability (such as operational reserves and metadata). When you filter through the noise and find the signal, it’s just math.
Higher is better, as long as you account for the overhead cost. Keeping this number in mind when you plan helps keep your storage healthy. It gives you what you need when you need it. It also helps you avoid panicking about running out of space unexpectidly. It puts a bit more clarity on something that can be a very unclear part of infrastructure planning.