RTO and RPO Calculator
Estimate a combined recovery target from business tier, outage tolerance, data loss tolerance, restore workflow, replication cadence, backup window, and dependency chain.
| RTO / RPO | <15 min | 15-60 min | 1-4 hr | 4-24 hr |
|---|---|---|---|---|
| <1 hour | Active-active | Hot standby | Hot app, backup data | Mismatch |
| 1-4 hours | Async replica | Warm standby | Snapshot restore | Loose data |
| 4-12 hours | RPO too tight | Fast restore | Image backup | NAS backup |
| 12-72 hours | Not aligned | Too much loss risk | Cold standby | Archive restore |
| Business process tier | Typical RTO | Typical RPO | Common recovery design |
|---|---|---|---|
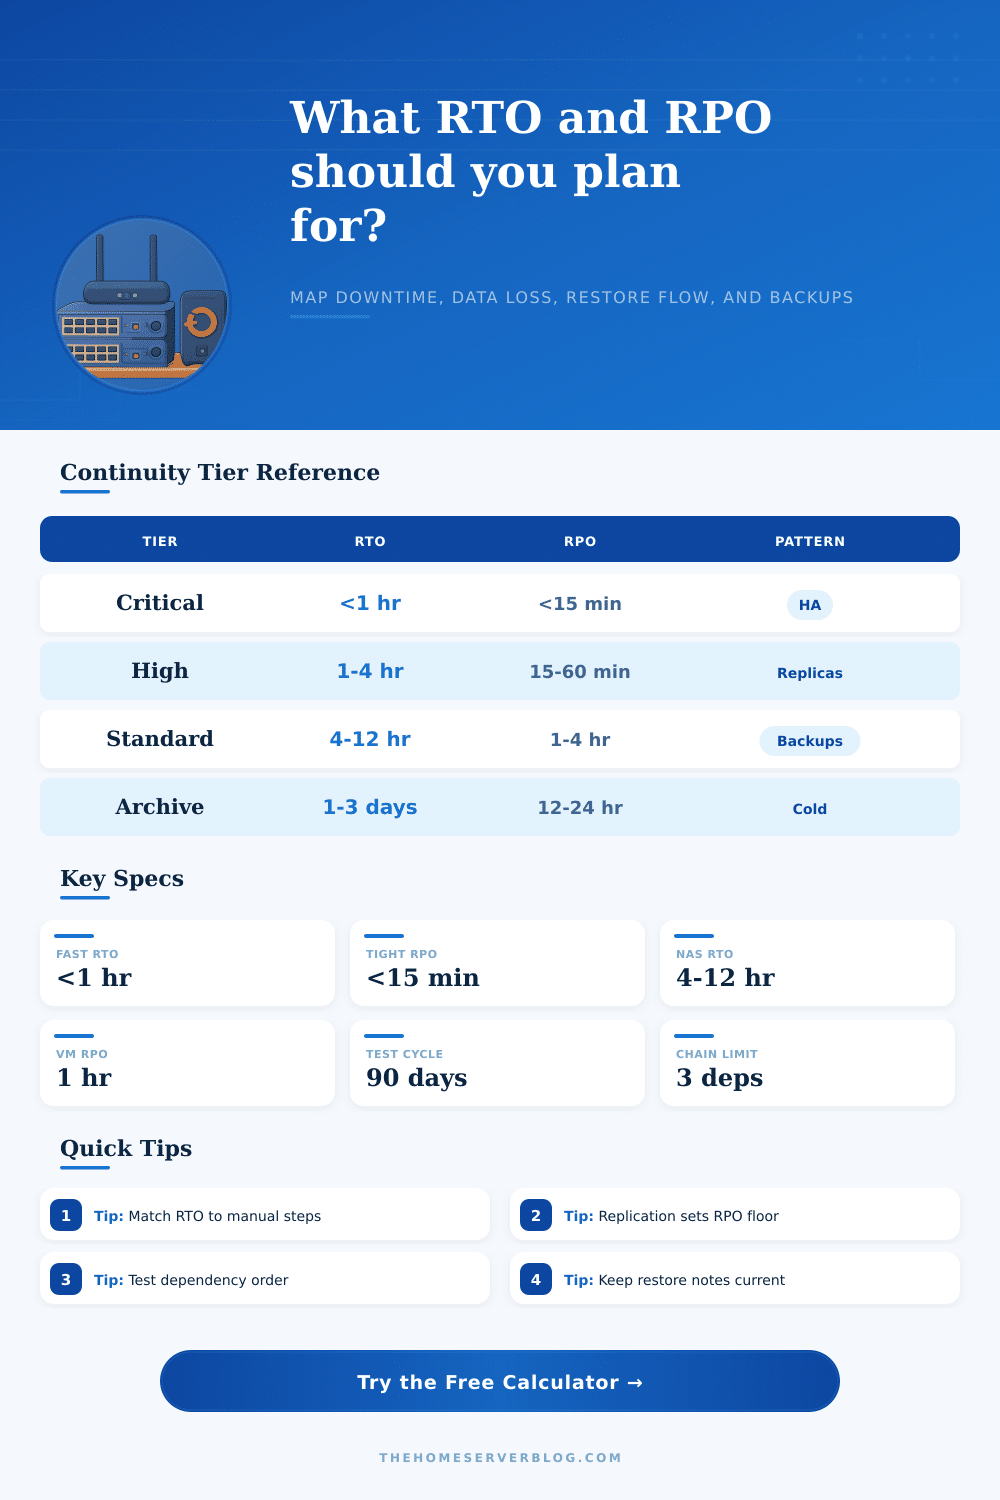
| Mission critical | <1 hour | <15 minutes | Clustered services, tested failover, journaled data |
| High priority | 1-4 hours | 15-60 minutes | Warm replica, frequent snapshots, scripted cutover |
| Standard | 4-12 hours | 1-4 hours | Image restore, hourly or four-hour snapshots |
| Support | 12-24 hours | 4-12 hours | Backup restore with manual validation |
| Archive | 1-3 days | 12-24 hours | Cold storage, documented rebuild, batch validation |
| Restore workflow | Base time add | RTO risk | Best use |
|---|---|---|---|
| Hot standby failover | 10-20 min | Coordination and split-brain checks | Identity, checkout, public apps |
| Warm replica promotion | 25-60 min | DNS, secrets, final sync, smoke tests | Databases, VM platforms, file services |
| Image or VM restore | 1-2 hr | Transfer speed and boot repair | Home lab VMs and NAS apps |
| File restore and rebuild | 2-4 hr | Package drift and permissions | Web apps, wikis, static services |
| Bare metal rebuild | 4-8 hr | Drivers, firmware, and hardware swaps | Physical servers and appliances |
| Dependency chain | Sequence add | Watch item | RPO impact |
|---|---|---|---|
| Single service | 10 min | Local config restore | No extra lag |
| App plus database | 25 min | Schema and credentials | Small replay delay |
| Identity, DNS, database | 45 min | Name resolution order | Login data must align |
| Shared storage chain | 70 min | Network mounts and locks | Snapshot consistency |
| External API chain | 90 min | Provider readiness | Queue replay window |
Recovery Point Objective (RPO) and Recovery Time Objective (RTO), which means “how much data loss can I tolerate in the event of an outage” and “how quickly can I get my systems back up,” respectively. They aren’t some abstract goal; they are engineering limits.
Enter the true constraints of your workflows into the calculator to eliminate overconfidence from your recovery planning process. It will run math for you so you understand physical reality of your application stack and storage network.
How This Tool Helps You Plan Recovery
Complexity in infrastructure affect both RTO and RPO. For example: “I want my RTO to be one hour,” and then you say, “We have to rebuild our bare metal servers!” No. That is manual work, so it includes drivers, firmware, and dependencies for each package. Hot standby failover is not manual. It is dependent on checking DNS and coordinating with other nodes. Slow processes doesn’t get you fast recoveries. This shows you what kind of workflow it is (for example, whether it require manual work or can be done via a hot standby failover). That way, you know what your true restore process look like.
How often you replicate affect how much data can be lost. Because your RPO floor matches your replication cadence, i.e., it’s an hour when you replicate hourly (testing won’t affect it). Replication keeps a copy up to date, and automation controls how fast you can switch over; you need both work together. Use this calculator to confirm whether your replication strategy will support your desired level of data loss. That’ll save you from making the typical error of thinking backup equipment solve two separate issues.
In theory, plans work fine until you get to dependency chains. If one service come back up fast, what about its dependencies? It requires DNS, identity services and perhaps a database. You need to stand these dependencies up before standing your service up so the calculator will add that time into the plan. By doing this, you’ve accounted for the additional time required based off how deep your dependency chain goes, if you don’t consider the sequencing, you’ll have all of the parts back online but none working together.
In practice, what does this look like? The reference table is below:
A mismatch between your RPO and RTO levels often indicate a flawed design. It means that maybe you have really good backups, but no way of failing over which is a bad design choice (the tool flags it with the gap score). You shouldn’t of spend money on investing in sub-hour recovery for your low priority archives. They’re both technical constraints and business decisions. A four hour downtime may be acceptable for internal wiki, but catastrophic for the checkout database.
This calculator helps quantify trade-offs, lets you test rather than guess, and transforms your vague anxiety into concrete minutes and hours. It’s not about preventing failure, since there’s no way to do that. It’s about surviving it with a clear plan and a clear understanding of exactly how many minutes and how much data you’re willing to sacrifice.