AWS Egress Cost Calculator
Estimate outbound AWS transfer using your own unitless charge model, traffic reductions, retained transfer, and workload behavior without relying on provider price examples.
| Workload Type | Main Driver | Useful Control | Watch Metric |
|---|---|---|---|
| Static site assets | Images, scripts, downloads | CDN cache rules and object versioning | Byte hit ratio |
| API responses | Repeated JSON and small objects | Compression and response caching | Request traffic factor |
| Media delivery | Large files and repeat viewers | Edge cache and adaptive variants | Retained transfer |
| Backup restores | Rare but large client pulls | Restore windows and regional placement | Peak multiplier |
| Input | Typical Use | Higher Value Means | Lower Value Means |
|---|---|---|---|
| CDN/cache offload % | Edge delivery modeling | Less origin transfer | More origin transfer |
| Compression % | Text, API, logs, manifests | Smaller post-cache payloads | Closer to raw size |
| Inter-region factor % | Replication or regional hops | More modeled internal transfer | More single-region behavior |
| Request traffic factor % | Headers and tiny object churn | More protocol overhead | Mostly large object traffic |
| Scenario | Traffic Shape | Estimator Focus | Best Next Check |
|---|---|---|---|
| Launch month | Spiky and uncertain | Peak multiplier | Daily transfer trend |
| Mature app | Stable and repeatable | Retained transfer | Monthly service split |
| Public downloads | Large object heavy | Cache offload | Top object list |
| Regional copy | Transfer between zones or regions | Inter-region factor | Replication reports |
| Review Item | Why It Matters | When To Review | Calculator Field |
|---|---|---|---|
| Cache logs | Shows avoidable origin transfer | After releases | CDN/cache offload |
| Object mix | Large files dominate GB totals | Weekly | Outbound volume |
| Compression report | Text assets shrink differently | Monthly | Compression |
| Architecture map | Reveals duplicated regional paths | Before scaling | Inter-region factor |
Sure, I’m happy that it’s loading faster, but how much am I being charged per byte of data leaving there servers? AWS charges for egress. They only charge for data leaving. Egress shows up as an additional line item in your AWS bill and looks like it shouldn’t be too expensive… until you start moving terabytes of data per month. It starts with a API response here and an image there. Before you know it, the number have added up to something substantial.
The calculator above do the math for you. But knowing why those numbers are where they are will help you save money.
How to Save Money on AWS Data Costs
Few teams knows their full bandwidth usage; they just make a wild-assed guess at how many users are hitting them times an arbitrary guess about average page size. This fails to take into account how today’s websites is built. You don’t actualy get billed for all the traffic flowing through your origin servers. A large part flows through CDN or edge caching infrastructure first.
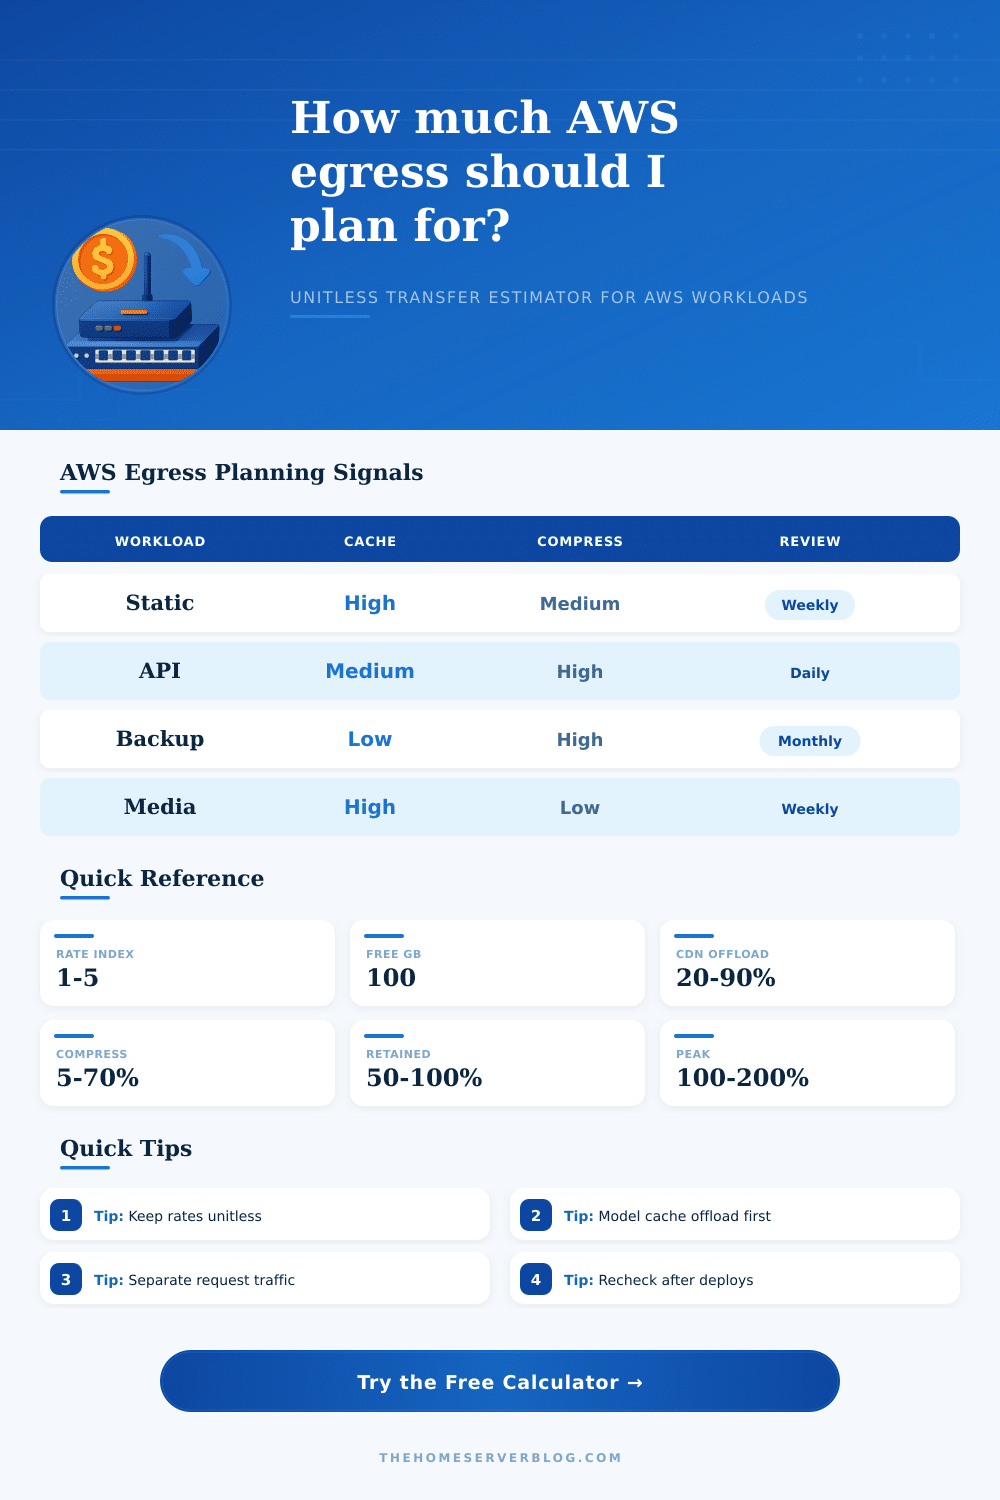
You can see this across different types of workloads in the reference table on the page. Static content are easy to cache, while API responses often churn through headers and small objects that resist compression. Understanding difference allows you to set more reasonable expectations around what traffic will count against the limit.
This is where the tool allow you to model these optimizations out in detail. You can tweak the percentage of cache offloaded to see the amount served at the edge. This might be higher if you’re running a mature application with good cache policies. That mean less data comes from your servers and you face lower costs.
Text-heavy payload formats such as HTML or JSON is also important here. Encoding them using Gzip or Brotli will greatly reduce their size. Once these are cached, we include this reduction in the calculator to give you a clearer view of what really leaves the region.
And then there’s the hidden trap of inter-region traffic. Maybe your databases is replicated across zones. Perhaps your backups gets synced across regions. That all adds up fast, and easy to overlook is that AWS charge differently for local versus cross-region transfers. With this, you can specify a multiplier on such hops so you don’t have to track each individual replication stream; you can model the additional load as a factor. While it’s a small tweak, it avoids undercounting when deploying in multiple regions.
Peak multipliers covers the variability of marketing pushes or launch events. Traffic isn’t typically flat. Modeling a spike will help you prepare for worst-case scenarios different than just average days.
One common mistake is assuming all outbound traffic behave the same. It’s not. By volume, it’s dominated by large file downloads; by requests, it’s dominated by frequent small API calls. This have implications for how to optimize costs. Compress response content heavily for the former, and cache large media files for the latter. Planning for these two things separately reveals opportunities that is hidden when you only look at average behaviors.
Transfer percentage retention helps model hybrid configurations with some portion of traffic leaving AWS completely through partnerships or other channels. The model remains flexible enough to reflect complicated architecture. Abstractions are useful because charge units are unitless. You plug in an internal rate index (instead of hardcoded dollars), which adjusts according to volume tier and region. Now teams can run scenario comparisons using their own cost model different than public pricing sheets.
The tool is now flexable enough to use for budgeting between projects or accounts without having to rewrite the formulas. The amount of data used for billing will appear alongside adjusted totals, making it clear what each layer of optimization add to the final number.
At a minimum, monitor the above metrics regularly, as part of your overall deployment pattern. The cache log will tell you when you’re missing chances after code changes. The object mix analysis will show you what’s still hitting origin servers needlessy. The compression report will let you know how well text payloads is shrinking. And the architecture map will alert you to replicated regional paths, which drive up inter-region factors. Checking these things once per month or week would of help avoid cost drift over time.
With planning, egress becomes a managed variable, not a surprise expense. If you design to be efficient with your cache, then compress what you can, then you get to control the flow. Monitoring and adjustments follow as your user base scales. Keep an eye out for those peaks, trust the reductions, see that billable volume dropping where it matters most.