Nines Availability Calculator
Convert uptime percentage into nines, downtime allowances, planned maintenance impact, incident budget, target SLA gap, and estimated redundancy gain for a home lab or small service.
The uptime target you want to meet.
Used as a second view against incident math.
Incident and maintenance fields are scaled to this period.
Use 24x7 for servers, VPN, DNS, storage, and public services.
Unexpected outages, failed updates, ISP drops, or power events.
Mean time from service loss to recovery.
Monitoring delay, manual triage, DNS TTL, or failover timeout.
Patch windows, firmware work, storage scrubs, or network changes.
Some SLAs exclude approved windows; user-facing uptime often does not.
Assumes independent failures after shared-risk adjustment.
Availability of one node, ISP path, host, UPS, or storage controller.
Common power, cooling, router, DNS, automation, and admin mistakes.
This calculator reports both incident-based uptime and entered uptime. Use incident math for planning, and entered uptime for checking monitoring reports or SLA statements.
Downtime Breakdown
| Availability | Nines Name | Downtime Per Month | Downtime Per Year |
|---|---|---|---|
| 99% | Two nines | 7h 18m | 3d 15h 36m |
| 99.5% | Two and a half nines | 3h 39m | 1d 19h 48m |
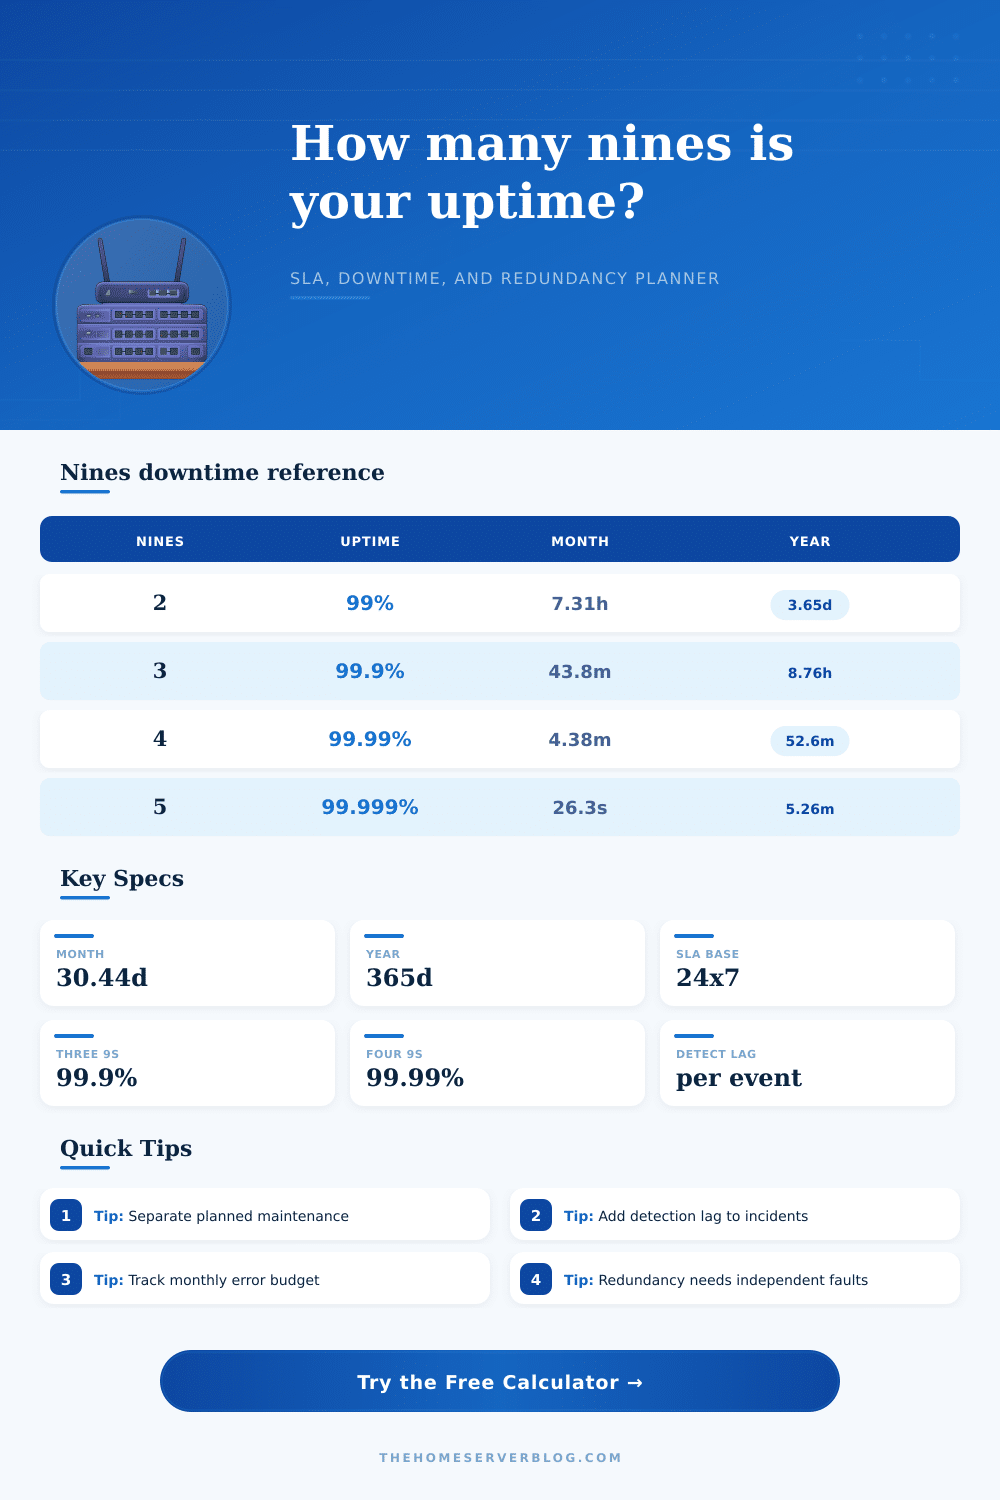
| 99.9% | Three nines | 43m 50s | 8h 45m 36s |
| 99.95% | Three and a half nines | 21m 55s | 4h 22m 48s |
| 99.99% | Four nines | 4m 23s | 52m 34s |
| 99.999% | Five nines | 26s | 5m 15s |
| 99.9999% | Six nines | 2.6s | 31.5s |
| Target SLA | Allowed Per Month | Example Incident Budget | Operational Fit |
|---|---|---|---|
| 99% | 438 minutes | 14 incidents x 30m | Lab, test host, noncritical NAS |
| 99.5% | 219 minutes | 7 incidents x 30m | Family storage, media, dev services |
| 99.9% | 43.8 minutes | 2 incidents x 20m | VPN, DNS, monitoring, home office |
| 99.95% | 21.9 minutes | 1 incident x 20m | Important remote access |
| 99.99% | 4.4 minutes | Automated failover only | HA pair, redundant network path |
| Model | Typical Components | Failure Assumption | Practical Limit |
|---|---|---|---|
| Single system | One host, one router, one ISP | Any major failure is outage | Simple but usually under 99.9% |
| Warm standby | Backup host plus manual restore | Recovery time dominates | Good for NAS and self-hosted apps |
| Active-passive | Two nodes with failover | One node can fail | Needs tested failover and shared storage care |
| Active-active | Two live nodes behind routing | Traffic shifts automatically | Shared database and DNS can still fail |
| N+1 cluster | Three or more nodes | One spare capacity unit | Capacity planning matters more than node count |
| Geo path | Second site or cloud relay | Site failure is survivable | Common identity, DNS, and data sync risks remain |
| Service | Reasonable Target | Monthly Downtime | Planning Note |
|---|---|---|---|
| Media server | 99% to 99.5% | 7h 18m to 3h 39m | Maintenance can usually wait for quiet hours. |
| Home NAS | 99.5% to 99.9% | 3h 39m to 43m | UPS and tested backups matter more than a perfect SLA. |
| VPN access | 99.9% | 43m 50s | Router, ISP, and dynamic DNS are common weak points. |
| Monitoring stack | 99.9% to 99.95% | 43m to 21m | Alerting should survive the system it watches. |
| Public web app | 99.9% to 99.99% | 43m to 4m | Use independent health checks and rollback plans. |
The lights go out on your home lab while you’re trying to get to a meeting. You know what that’s like if you run any kind of infrastructure yourself. Self-hosted sounds good because you’ll have control, what it usually means instead is a long chain of little, avoidable failures that turn into a big pile of annoyance. Track nines availability so you no longer guess at reliability. Now you can plan for it with real information.
Most people think of uptime as a fixed quantity printed onto a sticker. It’s not. It’s a budget of downtime you’re entitled to burn through. Three nines mean about forty-three minutes of downtime per month. Sounds like plenty, right? But you must remember that you can easily burn half your budget by lunchtime with a single failed update combined with a momentary hiccup from your ISP.
How to Calculate System Uptime
The key lies in knowing exactly what you’re measuring. Are you measuring the planned maintenance count? Does our monitoring system itself work well enough to notify us whenever something breaks? You can plug those numbers into the calculator above to have it do the math for you. But you’ll need to think carefully about how you define your inputs.
First, separate maintenance vs. Incidents. An incident is an unplanned outage, such as a service crash or power surge. Maintenance are a planned outage, such as rebooting a router or patching firmware. Some SLAs will not count maintenance toward uptime so their numbers are cleaner than the user experience justifies. Even if your contract allows it, your team needs that server up at 9 AM on Monday, and a half-hour reboot period feels like an outage. Define these two buckets separately so you get a more accurate sense of your operational discipline vs. This helps you measure how reliable whole system is.
The other place we go wrong is in thinking that redundancy buys us twice as much of anything. Having two servers doesn’t mean twice as much available. Quite often, it creates more failure points. This happens if they are running on the same network switch, on the same power strip or administered with same carelessness. The chart on the page makes this clear: redundant systems reduce theoretical benefit when their risks are linked. Two systems don’t add up to any nines at all if one guy trips over the rack’s PDU and unplugs them both. Actual redundancy mean isolation. This includes separate lines for power and separate lines for internet. It also involves automated responses to a problem so no human needs to intervene in an emergency.
Think of it as the detection lag factor. It is a common omission from simple availability models. It’s the time between a failure, your monitoring detecting it, and your failover mechanism kicking in. That’s counting against your downtime budget, so every minute counts. And if you’ve got a warm standby system which boots up and synchronizes its data for ten minutes then, well, you just lost ten minutes off your monthly allowance. The closer you can get to improving detection and automated recovery the less lag you’ll see.
How do you think about the services you operate? If you’re running a media server at home, two nines of availability are fine, you won’t even notice if it goes down during your movie buffer. But if you’re operating a business-critical VPN tunnel, a public-facing web application or something else that matters to other people, you want more like four or five nines. This isn’t just a matter of technology but also reputation and money: Every extra nine has an exponentially higher price tag and engineering effort behind it. Going from 99.9% to 99.99% typically means geographic distribution of data centers, sophisticated traffic routing, and active-active clusters.
You don’t need to hit some random number for the purpose of vanity metrics. The point is, match your infrastructure to the true worth of the service. Redundancy you’ll never test is a waste if it’s over-engineered into your hobby project. A lack of redundancy in your production system might cause downtime costing much more then what was saved by not buying extra hardware. You should of hit the sweet spot between responsibility and reliability.
Finally, availability isn’t about avoiding failure entirely. It’s about containing its consequences when it inevitably happens. Respect your architecture’s limitations. Monitor your incident budget. Translate abstract percentage points into concrete operational behaviors. If you do these things, you can do just that. Whenever you deploy an update or make a change, remember those minutes. Your budget is real, and there’s no amount of redundancy that’ll recover what you’ve lost after it’s spent.