Oversubscription Ratio Calculator
Estimate switch uplink contention or vCPU:pCPU oversubscription with utilization, bursts, east-west traffic, redundancy, target ratio, and reserved headroom.
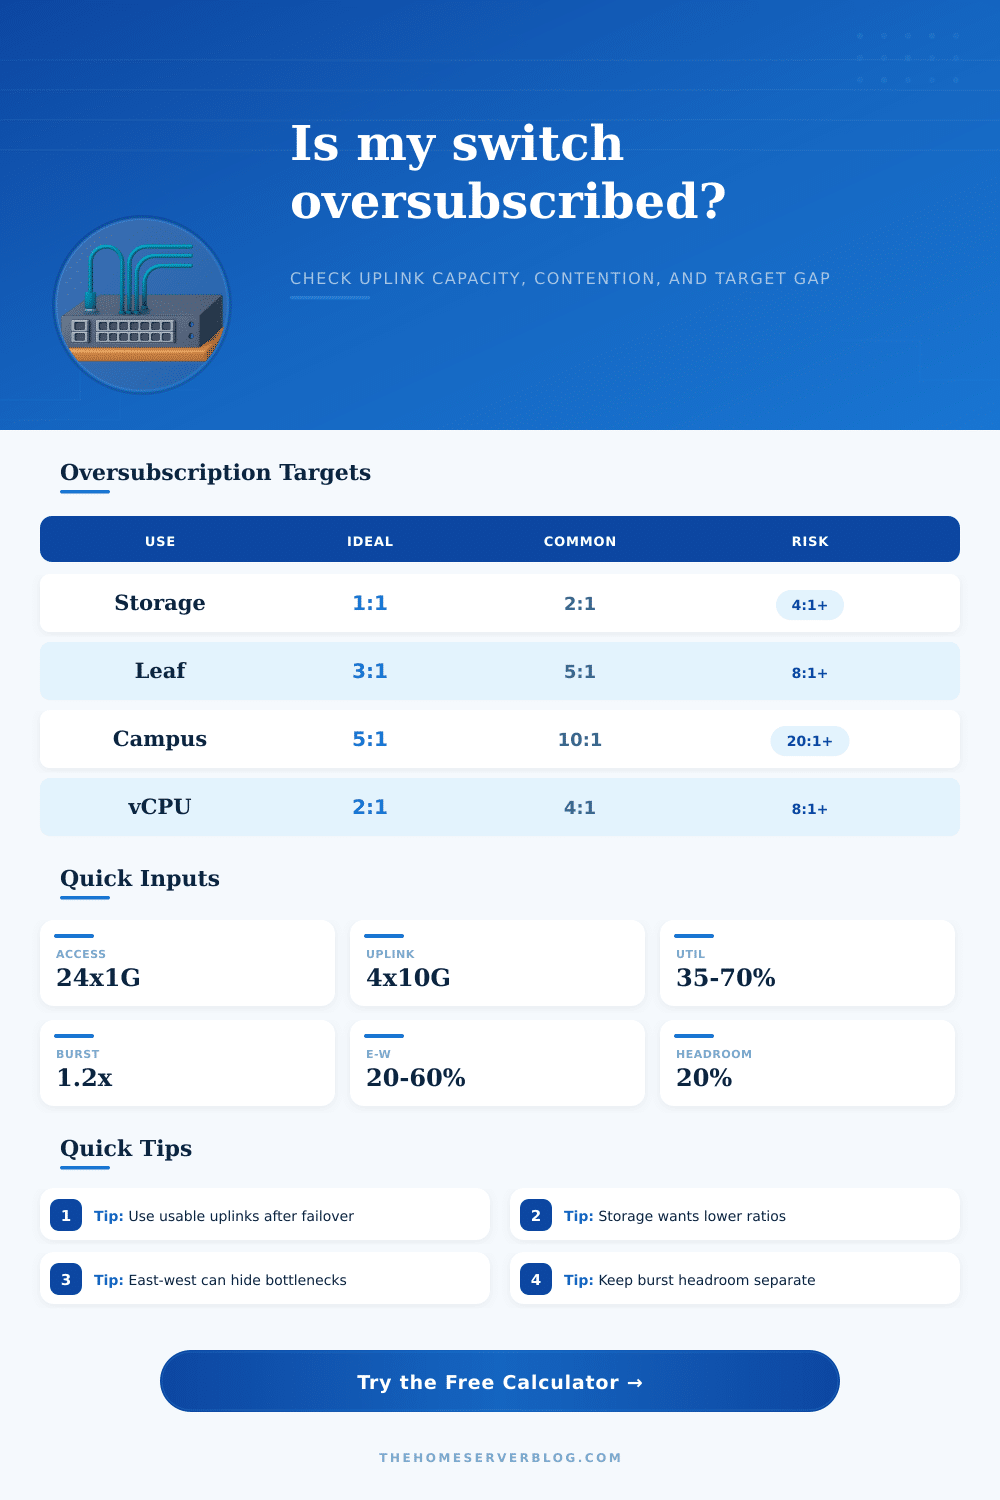
| Environment | Conservative target | Common planning range | Why it matters |
|---|---|---|---|
| Storage, backup, Ceph, iSCSI, vSAN | 1:1 to 2:1 | 2:1 to 4:1 | Storage latency rises quickly when bursts wait behind shared uplinks. |
| Virtualization host access | 2:1 to 4:1 | 4:1 to 8:1 | VM workloads are bursty, but live migration and backups can align. |
| General campus access | 4:1 to 8:1 | 8:1 to 20:1 | Most clients do not send at line rate together. |
| Leaf-spine server fabric | 3:1 or lower | 3:1 to 5:1 | East-west traffic and distributed storage make ratios visible. |
| vCPU:pCPU scheduling | 1:1 to 3:1 | 3:1 to 6:1 | CPU-ready time climbs when active virtual CPUs exceed runnable cores. |
| Topology | Capacity behavior | Failure behavior | Best fit |
|---|---|---|---|
| Single switch, all uplinks active | Simple sum of active uplinks | Any lost uplink reduces capacity immediately | Small home labs, noncritical access |
| LACP bundle to one core | High aggregate capacity, flow hashing per conversation | Survives link loss if switch path remains up | NAS, virtualization hosts, access stacks |
| MLAG or vPC pair | Both switches can forward actively | Plan for one member or peer-link event | Dual-homed servers and resilient racks |
| Leaf-spine fabric | Scale-out uplinks with predictable oversubscription | Failure domains are smaller if ECMP is healthy | Dense compute, containers, storage fabrics |
| Active/standby uplink | Only one side carries traffic in normal operation | Failover keeps service but not aggregate bandwidth | Simple firewalls, WAN edges, small cores |
Network engineers feel a specific kind of fear the moment they realize their design looks perfect on paper but fails in practice. “I’ve got a switch with twenty-four gigabit ports all going into two ten-gigabit uplinks, so what could go wrong?” On paper, it’s easy math. One plus one equals two.
That changes once you get hit by that backup window. Or when someone launches that virtual machine migration while another begins uploading a huge video file, your network is suddenly just as congested as any other highway during rush hour. At this point, oversubscription become more than an abstract concept, it defines the difference between a snappy or sluggish infrastructure.
Why Your Network Feels Slow and How to Fix It
In other words, it’s the “oversubscription”, the difference between supply and demand. Four ports running into one uplink? That’s an oversubscription rate of 4:1, which sounds scary, but then again, most people don’t max out all their bandwidth all the time. It’s really just about knowing what you’re measuring. Do you want the raw number? Or do you want to model how your apps and users behave? Define that in the calculator above, and it’ll crunch the numbers for you and turn your vague sense of fear into a specific amount of bandwidth.
People tend to only look at hardware spec numbers without considering the kind of traffic that will be competing against each other. A campus Wi-Fi access point is not going to behave like a web server farm, and a web server farm won’t act like a storage array. Storage sucks. If somebody streams a video and clogs up the uplink while your database tries to read data off disk, you’re going to see immediate latency spikes. There’s no buffer for disk I/O. Every byte matter in those environments; you want something closer to 1:1 there.
That’s what the table on the page does with the reference numbers, it paints such stark differences between kinds of access needed for storage vs. General campus access. Not all traffic is created equal.
And then, of course, there’s east-west traffic. A lot of the data in today’s data centers doesn’t leave the rack at all. It moves from one server to another inside the same cluster or switch. If you only account for north-south traffic exiting the building, you may well not have any clue how a bottleneck is developing inside the facility. By allowing you to account for east-west flow, the calculator helps identify bottlenecks that traditional throughput testing will simply overlook. It makes you recognize that internal chatter is every bit as important as exit from the building.
Another place our intuition tends to trip us up is in redundancy. Intuition tells you: “I can get twice as much bandwidth if I put two of these in.” So now you’ve got two uplinks. That’s redundant, right? But what happens when one of those links fails? Now you’re at half-capacity. And if you didn’t plan for this failure state, then your oversubscription ratio is doubled when something fails.
You designed it this way for a reason. This only works if you design for the worst case. Model your network with one component already broken. Use uplinks as if they are usable, even though some may be on standby or in spares. If your failover state is congested while your normal operating state is comfortable, you haven’t solved anything at all.
Oversubscribing is similar, but rather than applying to network packets it applies to CPU cycles. Sixteen virtual machines running across eight cores seems like a great utilization ratio … until one of your VMs tries to compile some code and then another does, and another, and another … The burst factor input provides a bit of a cushion for just such a situation. If you’re going to have occasional spikes in activity, you want to ensure there’s enough headroom that it won’t cause ongoing thrashing and/or degrade performance. It is a little thing, but it matters when people are sitting around waiting for their screens to update.
In the end, it’s all about risk management and expectation setting. High ratio? Great, you saved money on equipment, but you also have a greater risk of being oversubscribed at peak times. Low ratio? Sweet, you’ve got awesome performance but you’re burning budget on extra capacity when no one’s using it. Neither option is perfect (nor is it generally cheap or practical to avoid oversubscription altogether).
So how can you avoid this? Know your breaking point. Separate out effective use from raw ratios. Go from guesswork to planning. Stop hoping things will work out. Start building for the probable. Remember, though, that a network that hums quietly on a Tuesday may not last past Friday afternoon rush hour. But knowing your numbers makes it easy to sleep at night, whatever the users choose to do with their bandwidth.