CPU Ready Calculator
Convert VMware vSphere ready milliseconds into CPU ready percent, per-vCPU pressure, co-stop impact, contention rating, and a safe consolidation estimate for home labs and small clusters.
vSphere and Home Lab Presets
Ready Sample Inputs
Calculation Breakdown
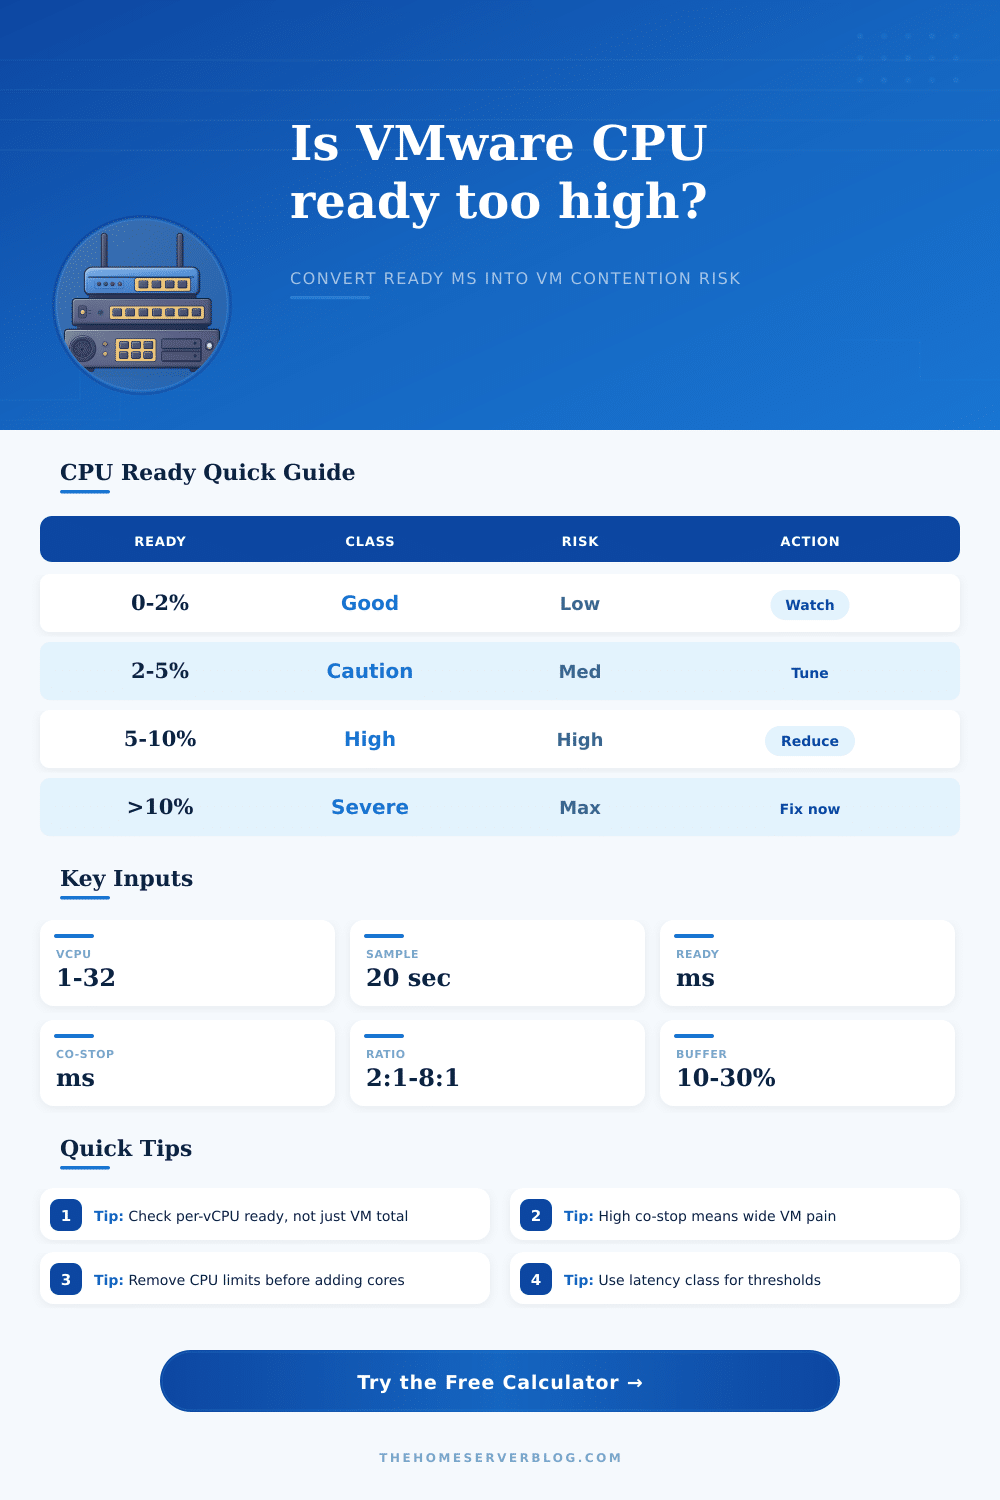
vSphere Ready Threshold Reference
| CPU ready percent | General interpretation | Typical action |
|---|---|---|
| 0% to 2% | Normal scheduler wait for most VMs. | Watch trend only. |
| 2% to 5% | Noticeable for interactive or latency-sensitive workloads. | Check vCPU sizing, limits, and host load. |
| 5% to 10% | High contention. Users may feel pauses. | Reduce overcommit, rightsizing, or move VM. |
| Over 10% | Severe CPU scheduling delay. | Fix urgently before consolidating more VMs. |
| Latency class | Ready target | Co-stop target | Planning ratio |
|---|---|---|---|
| Strict | Under 1% | Near 0% | 1:1 to 1.5:1 |
| Interactive | Under 3% | Under 1% | 2:1 to 3:1 |
| Standard | Under 5% | Under 2% | 3:1 to 5:1 |
| Batch | Under 8% | Under 3% | 4:1 to 8:1 |
Ready percent is a scheduling wait signal, not raw CPU usage. A VM can show low guest CPU usage and still suffer from ready time if the host scheduler cannot run it promptly.
Host and VM Spec Grid
Common vSphere Planning Tables
| Scenario | vCPU:pCPU target | Ready goal | Notes |
|---|---|---|---|
| Domain services | 3:1 to 6:1 | Under 5% | Usually bursty and tolerant. |
| Home lab Kubernetes | 3:1 to 5:1 | Under 5% | Watch noisy build or CI pods. |
| Virtual desktops | 2:1 to 4:1 | Under 3% | Interactive sessions feel ready quickly. |
| Database VM | 1:1 to 3:1 | Under 2% | Prefer reservation and fewer vCPUs. |
| Backup window | 4:1 to 8:1 | Under 8% | Acceptable only off-hours. |
| Metric | Formula used here | Why it matters |
|---|---|---|
| Ready % | ready ms / interval ms x 100 | Main scheduler wait measure. |
| Per-vCPU ready | ready % / vCPU count | Normalizes wide VMs for comparison. |
| Co-stop % | co-stop ms / interval ms x 100 | Wide VM scheduling pain signal. |
| Measured ratio | VMs x vCPU / pCPU cores | Shows actual consolidation pressure. |
| Safe VMs | cores x target ratio x buffer / vCPU | Planning count after risk adjustment. |
CPU Ready Tuning Tips
Even when your guest operating system tells you it’s only using small amounts of CPU, your virtual machines feel sluggish. This sounds familiar to many home lab or VMware administrator. It typically isn’t caused by anything wrong with your applications. Instead, it’s due to the scheduler which is keeping your vCPUs hostage until a physical core becomes available.
Ready time are the main indicator of CPU contention in a virtualized environment. It directly relates to system responsiveness and user experience. Unfortunatly, ready time doesn’t appear anywhere near a typical performance chart, so most folks don’t look at it. To solve this, simply enter your sample data into the calculator above, which will compute it for you. It takes the guesswork out of translating raw millisecond numbers.
Why Your Virtual Machines Feel Slow
Ready time represent how long a vCPU was sitting around ready to execute but couldn’t due to lack of physical cores. Consider if your VM has four virtual processor and all those vCPUs spend half their time waiting around. No matter how powerful the underlying hardware is, end result would be like watching movie on a phone in slow motion. Without normalizing based off how many vCPUs are provisioned to the VM, looking at total amount of ready time in milliseconds can be misleading.
The single biggest mistake I see admins making around “slowness” is adding more vCPUs. More often than not, this only makes the issue worse. When you have a wide VM with a lot of virtual processors, host scheduler has to find free cores for each one at the same time. If any one core is busy, whole group of threads can stall. This is called co-stop time. It is a very serious kind of scheduling penalty that standard ready metrics alone do not shows well.
The page does a good job laying it out in reference table. As co-stop rises, so does risk. So when you look at ready, always look at per-vCPU ready (not just the aggregate number). High average ready can mask one vCPU that’s totally starved while others is sitting idle.
Your ratio depends on context Consolidation ratios depend less on numbers and more on context of those numbers. Ready time will vary with different types of applications. Production environments serving up real-time database transactions or voice over IP will require lower ready times. This is different than a home lab used for development builds and backup jobs. That’s where the Latency Class comes into play. It lets you choose the threshold around what is an “acceptable” level of performance.
Interactive desktop apps should keeps their latency below three percent. Batch processing could easily get by with eight percent during off hours. Knowing that prevents you from buying too much costly gear to serve workloads which don’t demand immediate response.
Watch for other kinds of artificial constraints (such as CPU limits). Even with plenty of idle host capacity, a hard cap on MHz can cause ready-like symptoms; the scheduler will deliberately throttle the VM. Unnecessary caps are frequentely easier to remove than purchasing additional hardware.
By adding a buffer to your target overcommit ratio, our calculator estimates how many you might safely combine without experiencing contentions. This buffer considers expected spikes and background agents, including interrupts, which can cause otherwise-stable systems to go into contention territory. You should of added a buffer if you want stability.
In summary, control over CPU ready time comes down to balancing predictability and density. How many VMs can we put on a host while maintaining an acceptable user experience for everyone who relies on those hosts? If there’s no ready time then that’s great but that’s also an impossible ideal in shared environments. Instead, you want to keep it below a limit where a human or a critical process would notice a delay. To understand the state of your infrastructure you should track this against peak usage times instead of quiet nights when everything seems fine.
Go slow, measure well, and resist the urge to just throw vCPUs at it unless you have hard data showing demand exists. This methodical approach will ensure your lab remains smooth-running and your users stay happy.