Bandwidth Capacity Planning Calculator
Estimate required bandwidth for users, devices, traffic peaks, concurrency, protocol overhead, QoS reserve, growth, redundancy, and uplink upgrade timing.
⚡Named network presets
📊Capacity inputs
Bandwidth capacity plan
🖧Bandwidth standard grid
📘Capacity planning reference table
| Workload | Typical average per device | Peak multiplier | Planning note |
|---|---|---|---|
| General web, email, SaaS | 1 to 4 Mbps | 1.5x to 2.5x | Many users are idle, but browser updates and file sync can align. |
| Video meetings and streaming | 3 to 8 Mbps | 2x to 3x | Latency and jitter matter, so reserve QoS before accepting high utilization. |
| NAS backup or replication | 10 to 80 Mbps | 2.5x to 4x | Batch windows create predictable bursts; plan the maintenance window separately. |
| IP cameras and IoT telemetry | 1 to 12 Mbps | 1.1x to 1.8x | Continuous streams are less bursty, but they consume capacity all day. |
| Virtualization and containers | 5 to 40 Mbps | 2x to 3.5x | Live migration, image pulls, and backups can stack on top of app traffic. |
⚙Uplink and redundancy table
| Redundancy mode | Usable capacity model | Failure behavior | Best fit |
|---|---|---|---|
| Single active uplink | One link at line rate | No bandwidth remains if that uplink fails. | Simple home networks and noncritical labs. |
| Active-active aggregation | All links counted, then reserves applied | Link loss reduces aggregate capacity immediately. | LACP bundles, switch stacks, and NAS aggregation. |
| N+1 link reserved | Total links minus one spare link | One member can fail while keeping the planned capacity model. | Switch uplinks where failover load must still fit. |
| Active/standby failover | Only the active side is counted | Failover preserves service but not aggregate throughput. | Firewall pairs, WAN backup, and simple HA routing. |
| Dual WAN, one circuit failure | One circuit held as failure reserve | Plans for the smaller usable state instead of the sunny-day sum. | Business internet, SD-WAN, and ISP diversity. |
💻Common network sizing table
| Network scenario | Typical clients | Common uplink | Capacity planning focus |
|---|---|---|---|
| Home office with calls | 5 to 15 devices | 300 Mbps to 1 Gbps WAN | Keep video calls below the upgrade threshold during file sync. |
| Small business LAN | 20 to 80 users | 1 Gbps to 10 Gbps core | Account for SaaS peaks, guest Wi-Fi, and backup traffic. |
| Home lab virtualization | 3 to 12 hosts | 10 Gbps to 25 Gbps fabric | Plan live migration and storage replication as peak events. |
| Camera VLAN | 8 to 64 cameras | 1 Gbps to 10 Gbps switch uplink | Continuous upload is predictable but leaves less burst room. |
| Wi-Fi AP aggregation | 2 to 12 APs | 2.5 Gbps to 10 Gbps uplinks | Concurrency assumptions matter more than radio headline rates. |
🧮Formula breakdown table
| Metric | Formula | Why it matters | Result use |
|---|---|---|---|
| Base active demand | Devices × average Mbps × concurrency | Converts inventory into a busy-hour load estimate. | Baseline before bursts, reserves, and growth. |
| Peak demand | Base demand × peak multiplier | Models meetings, backups, downloads, and synchronized usage. | Starting point for required bandwidth. |
| Required bandwidth | Peak demand with overhead, QoS, and growth | Shows the bandwidth the design should survive. | Compare against usable uplink capacity. |
| Upgrade threshold | Usable capacity × threshold percent | Prevents waiting until the link is saturated. | Plan refreshes before user experience suffers. |
Remember that moment on the video call where just before you make your key point, the video freezes? You’re not unlucky; you’re mathematicaly disadvantaged. Until bandwidth capacity planning become more exact science, it’s always going to be guesswork, but then you remember: it’s just simple math in disguise behind the curtain of human variability.
Whether your network hums or melts during busy hour depend entirely on whether youve accurately estimated your demand relative to your pipes capabilities. The trap is sizing your network for average day. The average is polite. It’s the spikes that break things.
How to Plan Your Network Size
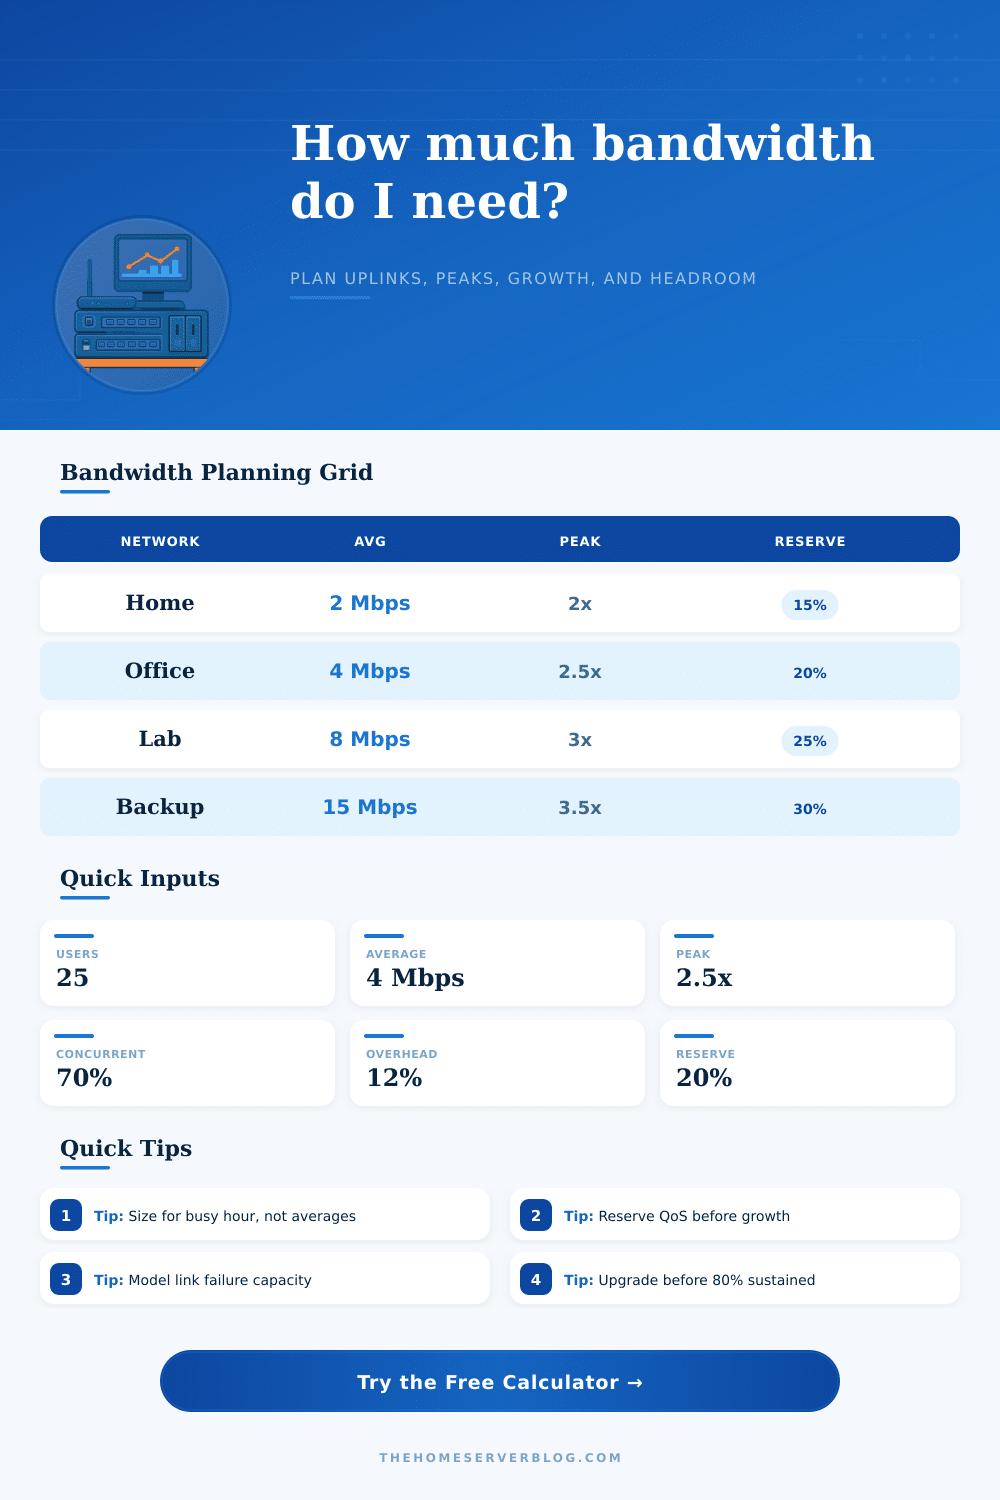
You need to size for the busy hour, that time of day when everyone want to send an email, join a meeting, and sync their files at the same time. Avoid underestimating just how heavy simultaneous usage can be. Define your number of user and your concurrency rates, and this calculator will do math for you.
That’s the secret variable: Concurrency. Your network might have fifty device connected to it, but maybe only thirty are active at any given time. Don’t provision for all fifty. Get that percent right and you avoid bottlenecking while still preventing overbuild.
Protocol overhead is another unnoticed silent killer. Before one byte of real data hits the user’s eyeballs there are frames, IP headers, TCP acknowledgments, and encryption layers gobbling up your raw throughput. A buffer for that friction brings your effective speed closer to what you paid for. It is small on its own but it adds up fast with hundreds of simultaneous connection.
Redundancy turns everything on its head. Having two internet circuit doesn’t mean you get double the bandwidth. An active-standby configuration mean that only one of those links is ever in use. When one goes down, the other take over. Because of this, you would of never have more than one link’s worth of capacity.
Active-active aggregation gets you more total throughput; however, it adds complexity, as uneven load balancing can become an issue. A simple reference table on page illustrates how various types of redundancy affect the amount of headroom you end up with. Get the wrong model here and you may be paying extra for capacity you can never realisticly use in normal operations.
The majority of projects stumble at growth planning stage. A year later, traffic doesn’t remain constant. Users change their habits. New applications appears. Video resolution improves. You sized your link exactly to this moment’s maximum demand, now there’s no reserve. Next quarter that maximum shifts upward a little so you’ll have to upgrade again.
A QoS reserve is smart, it allows for some excess capacity while prioritizing critical traffic (like control packets and voice) ahead of bulk transfers. So even if the pipe is nearly filled, the important stuff makes it through anyway. That discipline avoids the “sluggish” network feel simply because someone is downloading a big file.
That’s your upgrade threshold. Typically, people sets their thresholds around 80% use (which gives them some breathing room, but doesn’t make them overpay for unused capacity). That’s the sweet spot, balancing comfort against cost.
Running constantly over that line results in a worse user experience even if you have piles of bandwidth “on paper.” Jitter will go up. Your latency will spike. You’ll start seeing occasional packet loss.
There’s no such thing as “the right amount.” Instead, it’s about understanding what your traffic look like. Capacity planning isn’t about reacting to slow downs. It’s about avoiding them by thinking of your infrastructure as a living system that breathes based off your usage pattern.
How do you account for overhead, peak times, and anticipated growth? You don’t simply want faster speeds, you want reliable performance, all the time, especially when it really counts. Ideally, you want your network in the background. Your network should work so well you won’t even notice it’s there … unless someone wants to know why it’s always so fast.