Page Views to Bandwidth Calculator
Estimate daily bandwidth, monthly transfer, origin bandwidth, CDN savings, hotlink load, growth impact, and bandwidth cap headroom from page views per day.
⚡Traffic presets
📊Bandwidth inputs
Bandwidth estimate
🧮Traffic component grid
🌐CDN comparison grid
📘Bandwidth by page views table
| Daily page views | 1 MB page | 3 MB page | 6 MB page | Planning note |
|---|---|---|---|---|
| 1,000/day | 29 GB/month | 88 GB/month | 176 GB/month | Small sites can still hit low shared-host caps with large images. |
| 10,000/day | 293 GB/month | 879 GB/month | 1.76 TB/month | Compression and image optimization become visible on invoices. |
| 50,000/day | 1.43 TB/month | 4.29 TB/month | 8.58 TB/month | CDN and cache headers should be treated as core infrastructure. |
| 250,000/day | 7.15 TB/month | 21.46 TB/month | 42.92 TB/month | Origin protection matters more than raw monthly transfer alone. |
💾Cache, compression, and CDN table
| Layer | Typical range | What it changes | Best use |
|---|---|---|---|
| Gzip or Brotli | 0.35x to 0.85x | Reduces text, HTML, CSS, JS, JSON, and SVG bytes. | Enable globally, but do not expect JPEG or video to shrink much. |
| Browser cache | 20% to 80% repeat savings | Reduces repeat visitor asset requests. | Version filenames so long cache lifetimes are safe. |
| Reverse proxy cache | 40% to 95% hit rate | Reduces dynamic page generation and origin bytes. | Great for public WordPress, docs, and marketing pages. |
| CDN offload | 40% to 95% origin savings | Moves delivery to edge servers near visitors. | Use for images, CSS, JS, fonts, downloads, and public pages. |
| Hotlink protection | 0% to 100% blockable | Stops other sites from consuming your image bandwidth. | Enable when image traffic spikes without matching page views. |
📈Traffic preset reference table
| Traffic profile | Views/day | Page weight | Cache/CDN pattern | Watch item |
|---|---|---|---|---|
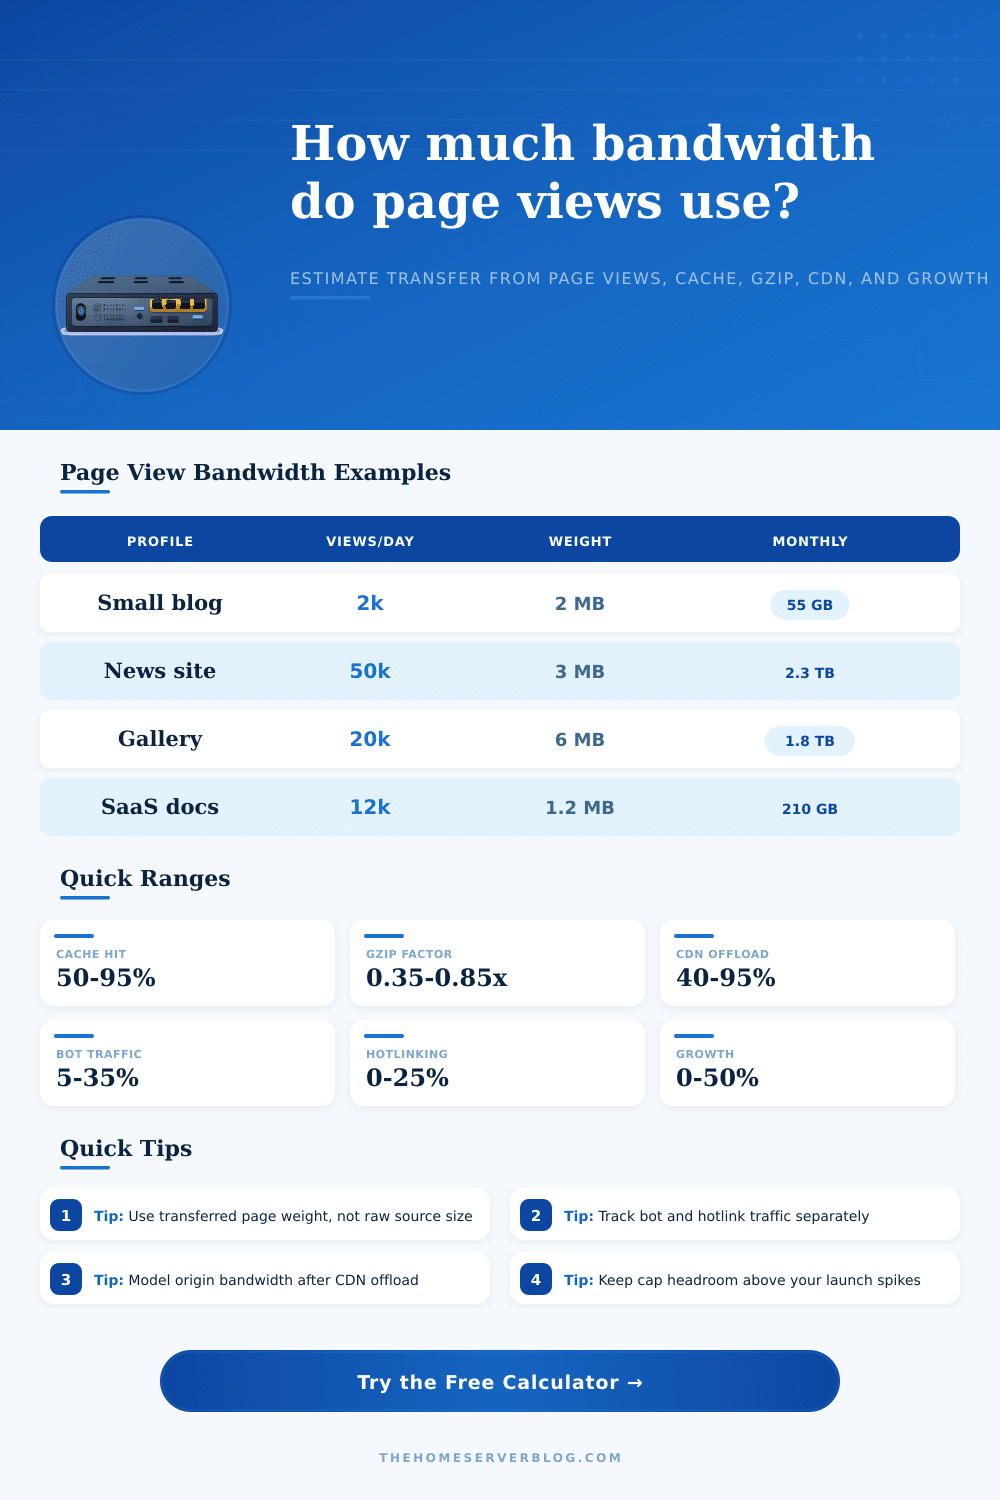
| Personal blog | 1k to 8k | 1.5 to 3 MB | High page cache, moderate CDN | Theme images and fonts. |
| Static documentation | 2k to 25k | 0.7 to 1.8 MB | Very high CDN hit rate | Search crawlers and versioned assets. |
| WordPress magazine | 20k to 150k | 2.5 to 5 MB | Good CDN, variable page cache | Ads, embeds, and social crawlers. |
| Image gallery | 5k to 80k | 5 to 12 MB | CDN critical | Responsive image variants and hotlinking. |
| SaaS app | 10k to 100k | 2 to 6 MB | Static app cache, dynamic API misses | Authenticated views reduce shared caching. |
⚙Formula table
| Result | Formula | Meaning | Planning note |
|---|---|---|---|
| Daily bandwidth | Views/day x page weight x gzip factor x hotlink factor | Visitor-facing daily transfer. | Includes bot views because they still consume bandwidth. |
| Monthly bandwidth | Daily bandwidth x 30.4375 x growth factor | Forecast transfer for the next month. | Use growth when planning plan upgrades or launch campaigns. |
| Origin bandwidth | Monthly bandwidth x cache miss x CDN miss | Bytes your server sends after cache and edge delivery. | Origin egress is usually the number that protects the VPS. |
| Cap headroom | Bandwidth cap - monthly bandwidth | Remaining transfer before the plan limit. | Negative headroom means the cap is exceeded. |
But how many of us have launched a new site only to open our wallet in hopes that we’ll recieve the first hosting invoice? It’s happened far too many times and it’s not because of the number of hits or traffic, it’s because of the hidden baggage that comes with every click. Every single page view seems innocent enough as you read it: just HTML, some CSS and JavaScript and maybe an image or two. Add those bytes together and they gets heavy real quick … unless you’re tracking them.
After plugging in your estimated page weight and daily views, the calculator do the math for you, so you don’t have to guess if you need a 128 GB plan for next month. People tend to underestimate their average transfer size by looking at the source code instead of bytes being transferred. Use the network tab in your browser developer tools to see how much compression cuts down on the actual cost. Text-based assets can be shrunk dramaticly (Gzip or Brotli) while video or already compressed JPEGs won’t benefit at all. That’s an important difference as it dictates what’s heavy vs. Bloated.
How to Manage Your Website Bandwidth Costs
But then what? Who is actualy viewing these pages? On popular sites, up to (or even more than) half of the requests per day are by bots. These is machines that don’t care one bit about user experience but still consume your bandwidth allowance. The tool allows you to adjust for bot traffic and separate useful visitors from automated uptime monitors or scrapers. Otherwise your origin server will be serving the same static pages over and over again thinking it is handling unique human request.
That’s why cache hit rates exist… To prevent wasting bandwidth. A CDN edge server or a reverse proxy will serve a cached version instead, your origin won’t have to generate it. That’s where most of the hosting cost drops off.
There’s also a quiet one called hotlinking. If other sites aren’t properly embedding your images, they may be hotlinking to them by linking directly to them from their own site. This cause your server to pay for views on their pages as well. To catch this, check your referrers and look for patterns; then you can start redirecting/blocking those requests, but only after you’ve caught it. The calculator has an input for hotlink overhead so you can work out what additional load this would represent in real world usage.
Planning for growth is usually an afterthought, which is exactly why plans fails during successful launches. Typically, planning for growth isn’t something we think about, and that’s precisely why our plan fails. What happens when your marketing campaign goes viral? Or you write a blog post that doubles your traffic next month? Your existing capacity may dissapears overnight. Model this growth curve in advance so you’ll have the breathing room to scale up rather than scramble once the meter hits “red”. That’s where reference table on the page helps set expectations before committing to any particular hosting tier.
But it’s not as much about the actual size of your files. Those sizes don’t mean anything unless you know the compression ratio. Then there is other factors like how well your caching works. The trick is knowing how to weigh transferred data. Weighting tells the story of what your net will experience. Throw in some sane guesses about your cache hit rate and suddenly the numbers don’t look so frightening, just doable.
A 10MB page seen by 50k users might not be such a problem when 90% of them come from an edge cache close to where the user sits. And that’s what most folks miss: they think in terms of raw volume, not how stuff gets delivered. The real key to keeping your server healthy is origin bandwidth, or the number of requests your actual application has to handle. Even when your traffic multiplies threefold, if your CDN handles eighty percent of those requests, then your origin will see just twenty percent more strain. You can thus separate out delivery capacity from processing/storage capacity. It is a little thing but it is huge for long-term stability.
Setting your baselines will feel like a chore at first, since you’re estimating multiple variables all at once. But it pays off fast, as you’ll track this stuff month after month without thinking twice. Instead of panic-buying due to some sudden spike, you plan upgrades based off how you actually use them. No more guessing!
The point of bandwidth management is to improve delivery paths rather than limit traffic. If you grasp the mechanics of edge delivery, caching and compression, if you know how they fit together, then those bandwidth caps cease being traps and begin appearing to be guardrails. The world keeps spinning without you having to worry whether your next click might break the bank. Just good housekeeping in the digital age, right?