etcd Database Size Calculator
Estimate Kubernetes etcd backend size from object count, average object size, retained revisions, compaction cadence, write churn, leases, quorum nodes, backend quota, and defrag frequency.
Estimated etcd backend
| Object family | Typical serialized size | Why it changes | Sizing note |
|---|---|---|---|
| Namespace, ServiceAccount, RBAC | 1-4 KB | Labels, annotations, rules | Usually many small records |
| Pod | 4-14 KB | Status, owner refs, env, volumes | Status churn can dominate writes |
| Deployment, ReplicaSet, StatefulSet | 5-18 KB | Pod template and rollout history | Old ReplicaSets add live objects |
| Secret | 4-40 KB | Encoded data and cert chains | Large TLS bundles move the average |
| ConfigMap | 2-64 KB | Embedded config payloads | Watch large app configs closely |
| CRD instances | 8-80 KB | Spec depth and status fields | Operators often create the largest rows |
| EndpointSlice | 3-20 KB | Endpoint count and topology | Changes with pod scale and rollouts |
| Event | 1-4 KB | Message text and involved object | Retention policy matters during incidents |
| Scenario | Objects | Avg size | Churn | Quota target |
|---|---|---|---|---|
| Kind or local dev | 1,000-3,000 | 3 KB | 50/hr | 2 GiB |
| Small HA production | 8,000-20,000 | 5 KB | 500/hr | 4-8 GiB |
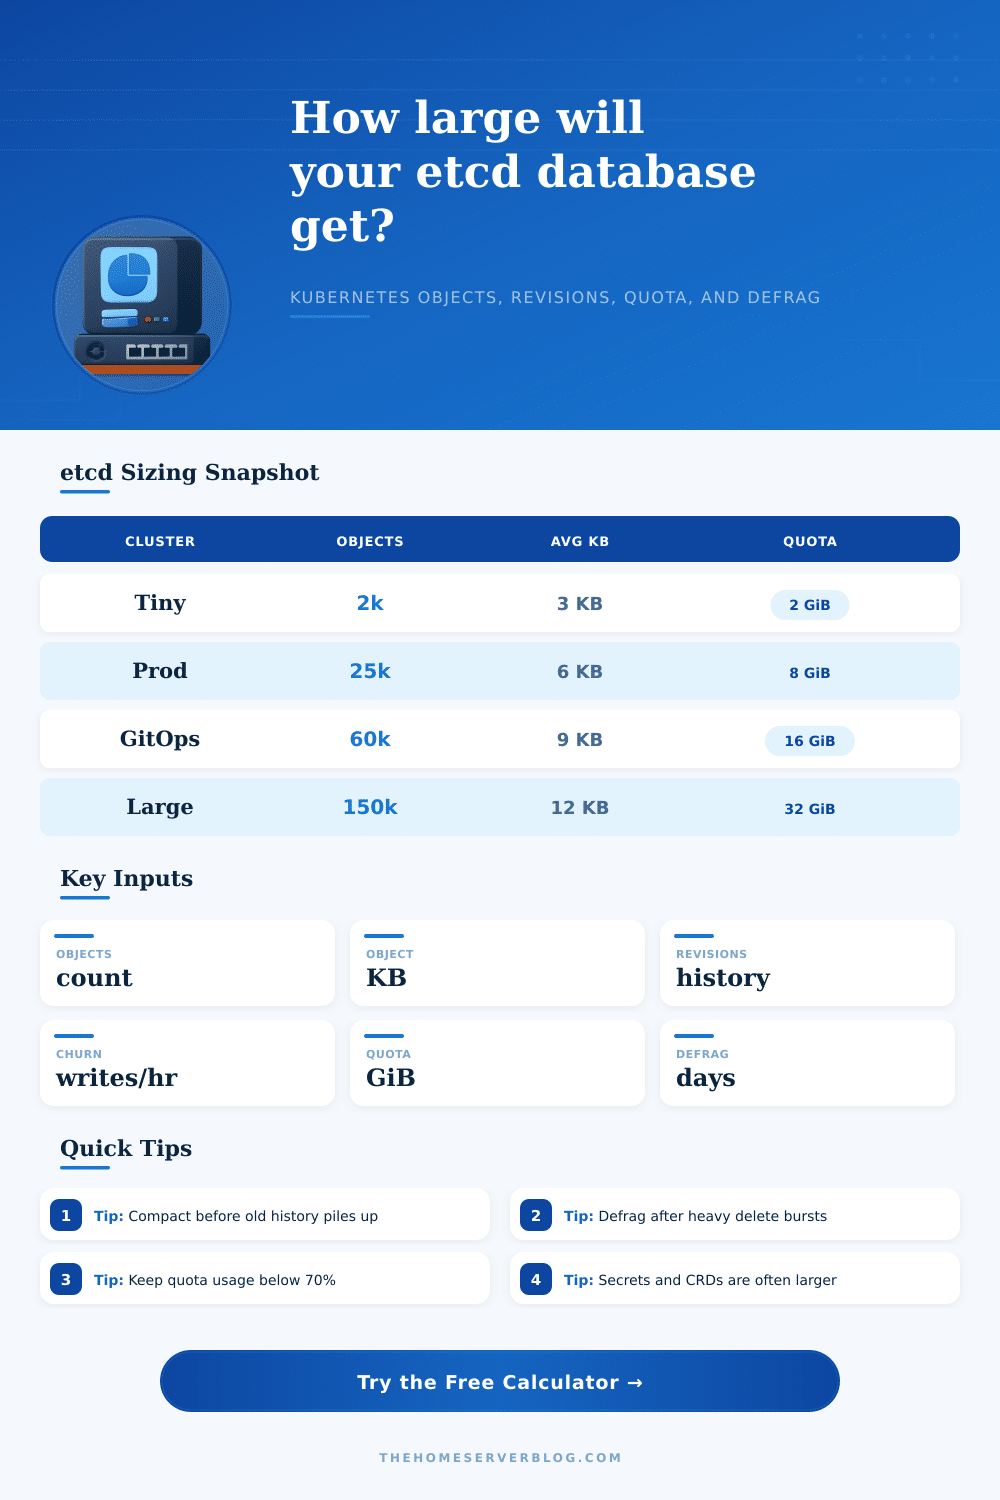
| Medium platform cluster | 25,000-60,000 | 6-9 KB | 1,500/hr | 8-16 GiB |
| GitOps or operator dense | 60,000-120,000 | 9-16 KB | 4,000/hr | 16-32 GiB |
| Large multi tenant cluster | 120,000+ | 10-20 KB | 8,000/hr | 32 GiB+ |
| Setting | Typical range | Database effect | Operational tip |
|---|---|---|---|
| Auto compaction | 1-24 hours | Drops old MVCC revisions | Use shorter windows for high churn clusters |
| Defrag cadence | Daily to weekly | Reclaims free bbolt pages | Run member by member, never all at once |
| Quota backend bytes | 2-32 GiB | Stops writes when exceeded | Alert at 70% and investigate at 80% |
| Watch churn | 50-10000/hr | Creates revisions and WAL activity | Check noisy controllers and Events |
Until etcd stops accepting any more writes. Which is when you realize it’s grown on you. You probably didn’t notice until your monitoring alerted you to a hung deployment and showed etcd was out of quota on a Tuesday morning. Behind the scenes, it had been slowly building up status updates, revisions, and leases until it hit the limit for the back end file. Now the size of etcd database could cause an outage.
Use this etcd database size calculator. It helps Kubernetes operators get concrete numbers on quota pressure, backend growth, retained revisions, and how long before defrag will be needed. From vague anxiety about control plane storage, get clear answers so you can start planning rather than just reacting.
How to Check Your etcd Database Size
So it’s just object count x average size. There are all sorts of objects in your cluster, but most folks eyeball the number of pods and try to guess how many there are; which is wrong! Pods aren’t the whole picture. You’ve got other stuff like custom resource definitions, endpoint slices, config maps, and even secrets. Those will add up pretty fastly.
A typical secret can vary from 4-40kb (depending on if you’re using certificate chains) whereas a deployment with rollout history is about 5-18kb. There’s no reason to assume everything is exactly the same; that’s why we let you plug in an average serialized size. That average climbs rapidly if you’re running lots of big TLS bundles or have a lot of operators in your cluster. Rather than guessing a flat value, use a weighted average based off what you see coming across your API server so you don’t underestimate the actual footprint.
The actual disk pressure is based on past data. Every time an object changes, etcd retains all previous versions until they’re removed by compaction. To understand how much space is being used, the tool models the buildup based on churn rate and number of retained revisions. When the churn is high, meaning lots of leases renewed, status patches, events, etc., you have thousands of writes per hour where each write creates a new revision layer.
Unless you compact regularly, these revisions build up over time. Deleting an object doesn’t free space right away. It just flags the key for deletion. The space won’t be freed until the database is defragmented. The key difference here is between logical cleanup vs physical reclamation… You have thousands of writes per hour generating hundreds or even thousands of new layers of revisions. Unless you compact regularly, these revisions build up over time. Deleting an object doesn’t free space right away. It just flags the key for deletion. The space won’t be freed until the database is defragmented. The key difference here is between logical cleanup vs physical reclamation.
When you run Defrag weekly, you may have only 80% of your free space available because there is still twenty or thirty percent of your backend file bloat. That’s because Defrag takes time. If you want more of your free space back into the pool, you need to run it more frequent. The calculator accounts for this extra work from fragmentation and will tell you what your real disk usage look like per member.
Keep in mind that each node in your HA cluster has a complete copy of the backend. In a three-node cluster, that triples your raw disk consumption for an equal amount of data. You can’t avoid this replication if you’re doing high availability, but you should be sizing your volumes with this multiplier in mind. Failing to account for this multiplier is one of the most common planning errors and results in emergency volume expansions during incidents.
You need headroom for quota management. The industry-standard guidance here is that you should alert when you’re at 70% used and investigate when you reach 80%. If your quota is set near where the needle currently sits, a noisy controller or an infrequent but large status update could cause a cascade of write rejections. With that in mind, the calculator illustrates what percentage of your quota you’ll fill based on your current usage (and shows how much room you’d have if you bumped up the limits).
It includes an encoding overhead factor for metadata variance and bbolt index structures. This varies; expect as little as a quarter if your cluster is lean, or as high as 60% with a lot of CRDs. Knowing those coefficients will help you avoid thinking disk file size == size of live data.
Prevention is better than a cure. Use the tool’s reference tables to check how your scenario compares with standard production patterns. It doesn’t matter if you have one small HA system or a dozen giant multi-tenant boxes; the arithmetic applies equally well. Plug in the real-life revision window and churn rate, and you’ll get an honest number.
Finally, tack on some buffer for that extra burst of growth during peak times. You don’t want to run low on disk space; you need to keep things running where it counts. Set yourself a comfortable quota limit, stick to a defrag regimen, and then when the dreaded Tuesday alert strikes, you’ll know right away why it occurred and what to do about it.