DynamoDB Write Capacity Calculator
Estimate write capacity units for standard writes, transactional writes, global table replication, GSI fanout, TTL/delete traffic, bursts, hot partition keys, and DynamoDB Streams overhead.
Write capacity breakdown
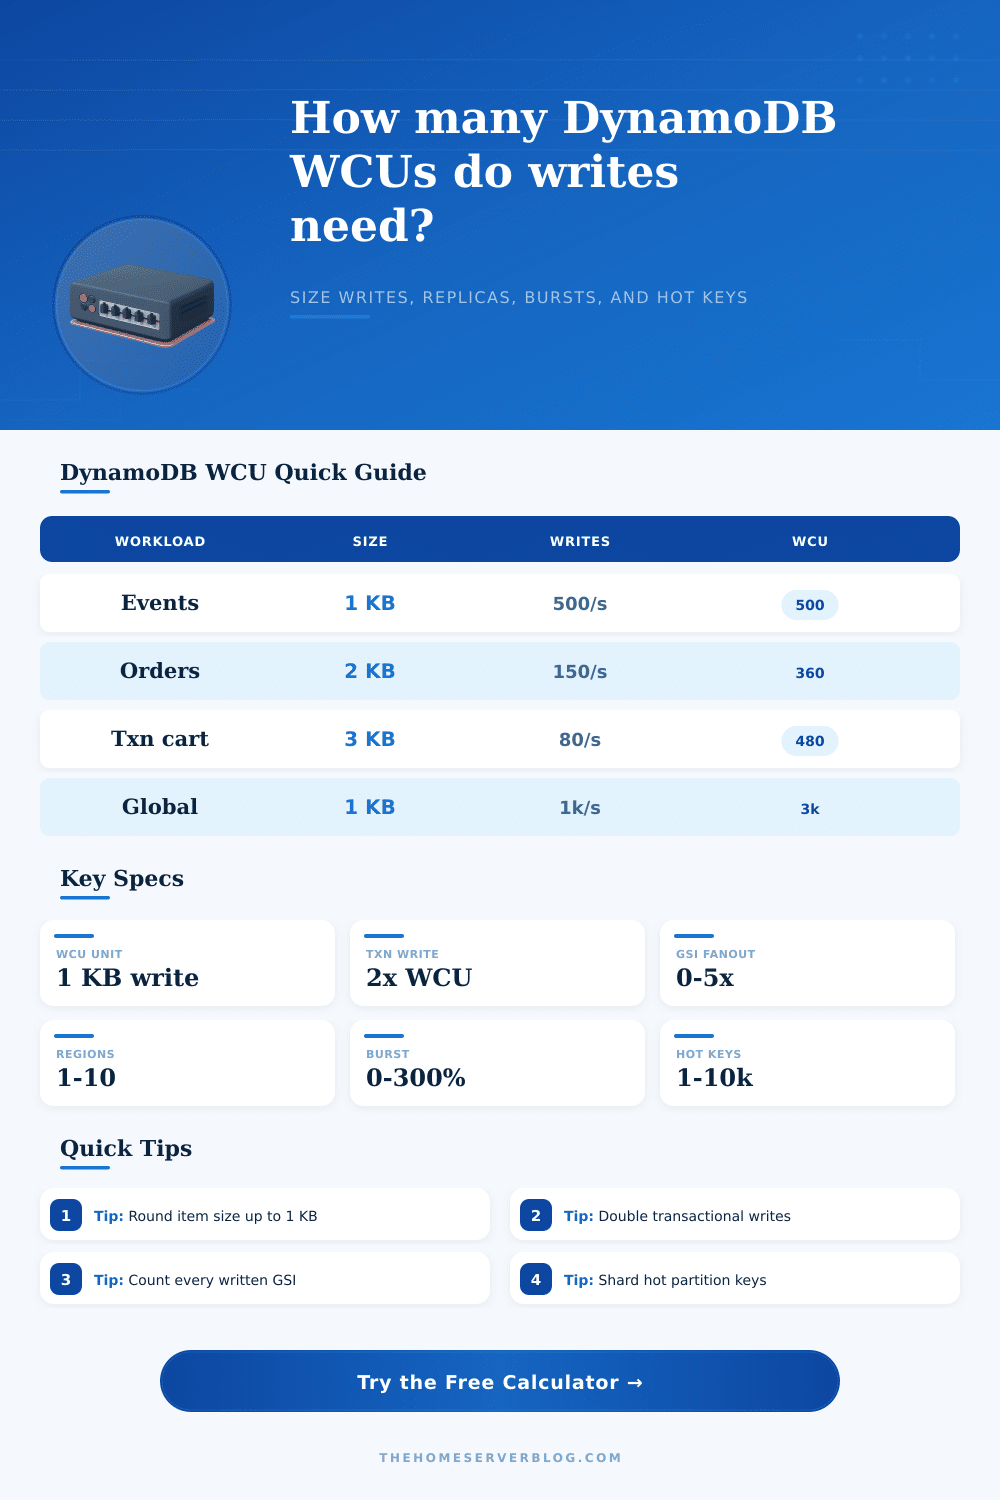
A 1.1 KB item bills as 2 WCUs for each non-transactional write.
TransactWriteItems uses twice the normal WCU for the same item size.
Each written global secondary index consumes additional write capacity.
Replicated writes should be planned for every participating region.
| Average item size | Standard write WCU | Transactional write WCU | 100 writes/sec | 1,000 writes/sec |
|---|---|---|---|---|
| 0.5 KB | 1 | 2 | 100 WCU | 1,000 WCU |
| 1 KB | 1 | 2 | 100 WCU | 1,000 WCU |
| 1.1 to 2 KB | 2 | 4 | 200 WCU | 2,000 WCU |
| 2.1 to 3 KB | 3 | 6 | 300 WCU | 3,000 WCU |
| 4.1 to 5 KB | 5 | 10 | 500 WCU | 5,000 WCU |
| 8.1 to 9 KB | 9 | 18 | 900 WCU | 9,000 WCU |
| Topology | Regions | Base local WCU | Estimated replicated WCU | Planning note |
|---|---|---|---|---|
| Single-region table | 1 | 1,000 | 1,000 | No global table replication budget. |
| Active-passive global table | 2 | 1,000 | 2,000 | Writes replicate into the second region. |
| Three-region global table | 3 | 1,000 | 3,000 | Useful for low-latency multi-continent writes. |
| Four-region global table | 4 | 1,000 | 4,000 | Watch write conflicts and index fanout carefully. |
| Global table with two GSIs | 3 | 3,000 | 9,000 | Index writes replicate too, so fanout compounds. |
| Pattern | Typical WCU drivers | Hot partition signal | Write sizing tip |
|---|---|---|---|
| Append-only events | Small item size, high writes/sec | Device ID or tenant ID dominates | Add time buckets or write sharding. |
| Order workflow | Transactions, status GSIs | Campaign or merchant traffic spikes | Separate audit events from order item writes. |
| Leaderboard updates | Frequent updates to few partition keys | Same game or season key repeats | Shard counters and merge asynchronously. |
| Session table | TTL deletes, short item lifetime | Login storm by tenant | Budget cleanup and renewal writes together. |
| Global user profile | Replication and conflict handling | Popular user or organization keys | Keep indexed attributes lean. |
| Payment ledger | Transactional writes and streams | Few account IDs get most updates | Prefer immutable ledger rows over hot balance rows. |
This estimator is for planning. Confirm production limits, adaptive capacity behavior, account quotas, and pricing with current AWS documentation before final provisioning.
You deployed an app that performs well in your staging environment. Throughput feels instantaneous and latency is low. You are ready to launch! You move to production and experience a spike in traffic.
Your code didn’t break, yet you overestimated the way DynamoDB counts writes; you’re watching as your throttles climbs toward the ceiling. On paper, write capacity units are simple, but in reality, they multiplies quietly. It’s a ceil() function on the basic unit: the kilobyte. Writing 0.1 KB cost one WCU; writing 4.1 KB costs five WCUs.
How to Count DynamoDB Write Costs
Those hoping for linear scaling will find this ceiling function frustratinger, as smaller changes force bigger jumps. Doubling from 2KB to 2.1 KB doesn’t add ten percent to your bill. It forces you into the next level with a thirty-three percent jump. This happens because that small increase move the cost to three WCUs.
So it all begins with an honest assessment of what your data looks like. Plug your numbers into calculator, and let it crunch through all rounding edge cases for you. This isn’t even the half of it though, since most production systems has Global Secondary Indexes (GSIs) to cover their various query patterns. Every time you write an item, DynamoDB also has to writes to any indexes that project out those attributes.
These extra writes consume more capacity, if you have multiple GSIs and you frequently modify your items, your effective write load can triple on the spot. This is the fanout effect: you’re paying the base write + the fanout effect. Multiplication happens and many engineer don’t notice it until they get the bill. It’s not a bug, it’s how it’s supposed to work, but it doesn’t forgives sloppiness in modeling.
Replication complicates the equation further. When you add replication into the mix (such as with Global Tables), each write to your primary region also gets written to all of your secondary regions. So a 1000 WCU load in us-east-1 becomes 2000 WCUs when replicating to eu-west-1. Paying for that write bandwidth twice (or three times) doesn’t feel like much, but it’s redundancy… Free at first, but ultimataly paid for by the math. Budget for the replicated traffic, not just the originator.
That’s what the reference table makes clear; it shows the total capacity required based off the topology. Next, there’s transactional writes which wrap multiple items and ensure they happens atomically. They are great for payment ledgers, inventory checks, and so on. But the catch is that they cost twice as much (the “two times” multiplier on capacity). That five KB write that would of been five WCUs now is 10 WCUs when wrapped in a transaction.
And then there’s the whole issue of hot partition keys: DynamoDB can supports extremely large amounts of aggregate throughput but not unlimited traffic on any given hash key. If all your writes go through the same device token or user ID, you’ll reach the 1000 WCU per-partition limit no matter how much total capacity you provision. The only solution to that problem is usually to shard that key.
Burst capacity provides some breathing room for temporary surges. These occur when you go beyond your provisioned value for several seconds before returning to normal. Relying on bursts to handle sustained traffic are not a good idea as you’ll quickly burn through your credit pool and still find yourself throttled. This tool lets you visualize that burst capacity so you can account for steady state instead of crossing fingers and hoping.
It also factors in small overheads like TTL deletions and streams, things that don’t make it into early plans, yet add up over time. You want to model your worst case realisticly, while avoiding overprovisioning due to fear. Begin with your average item size and apply your write rate. Apply your region count. Add your index fanout. Double the writes for transactions.
If the answer seems high, well that’s alright; it’s better to know the true cost up front than to debug throttling errors at 3 AM on product launch day. Although the number can feel like a random setting in the console, write capacity reflects the complexity of your data architecture. Nail down your inputs and let the outputs do the talking. They’ll tell you precisely how much you should pays to sleep at night.