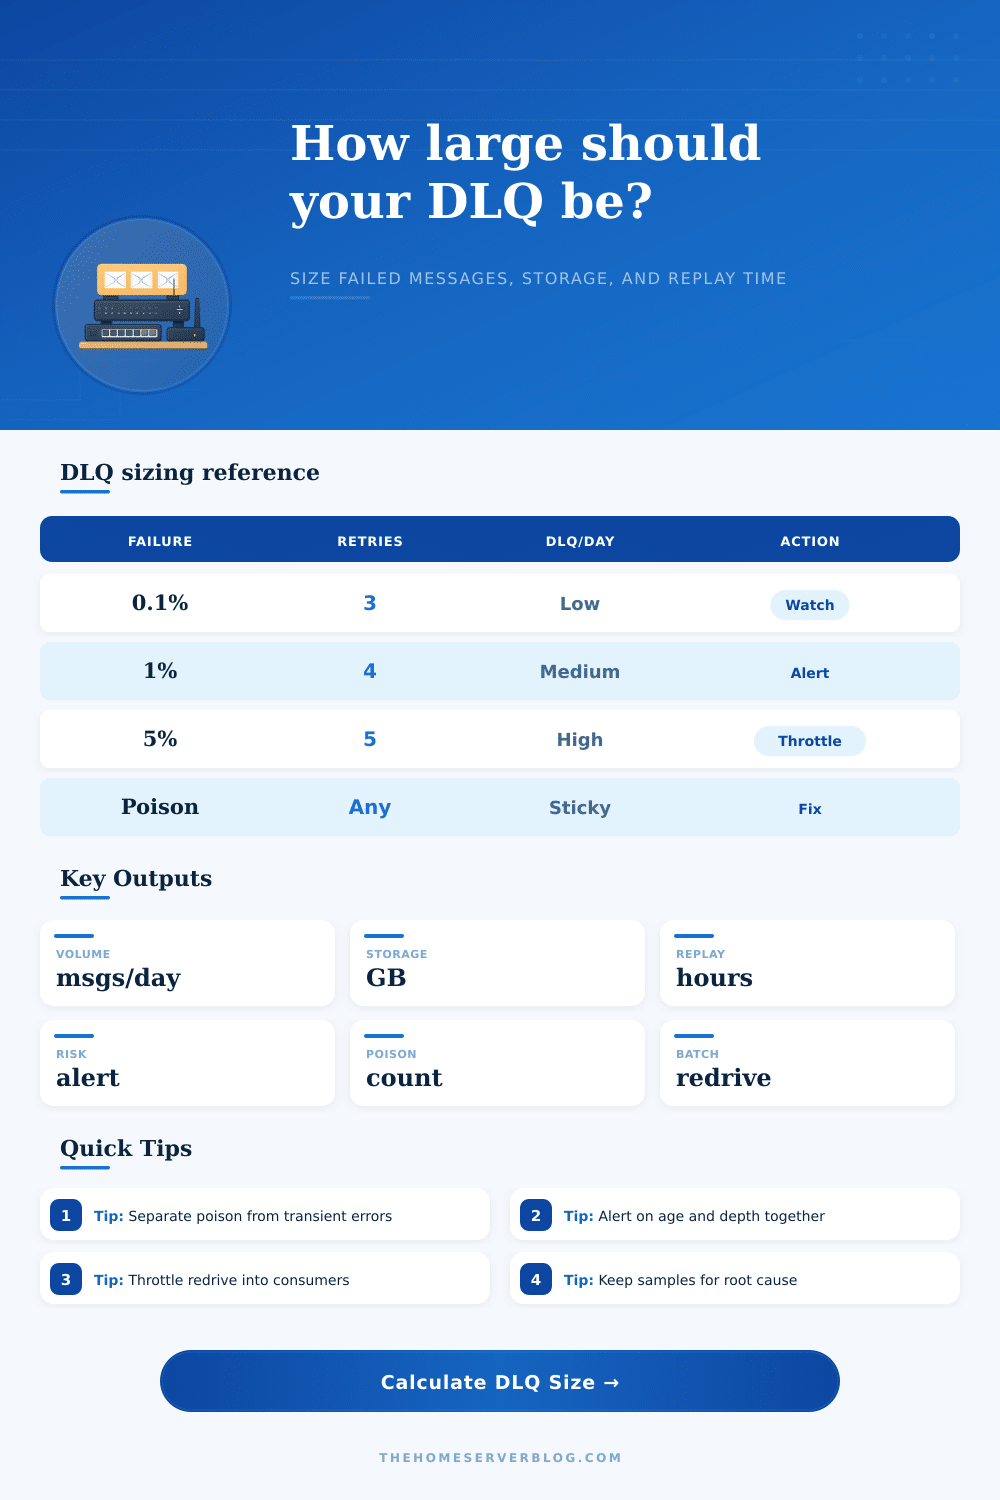
Messaging reliability planning
Dead Letter Queue Calculator
Estimate daily DLQ volume, retained storage, redrive replay time, alert risk, poison message pressure, and batch count for SQS, RabbitMQ, Kafka retry topics, Pub/Sub subscriptions, Azure Service Bus, and similar message systems.
DLQ sizing breakdown
Alert threshold load
Transient API errors
Retries usually help because the underlying dependency recovers. Watch retry storms and use jittered backoff before messages reach the DLQ.
Schema or contract drift
Failures are often poison until producers and consumers agree again. Keep original headers and schema version in the DLQ payload.
Consumer code defects
A deployment can move many messages to the DLQ quickly. Pause redrive until the fix is deployed and verified with samples.
Manual business review
Some DLQs are review queues. Size retention for human triage time, export needs, and audit expectations.
| Failure pattern | Typical symptom | DLQ sizing implication | Operational response |
|---|---|---|---|
| Rare transient faults | 0.01% to 0.1% failure rate with low poison share | Small DLQ, storage driven mostly by retention policy | Alert on nonzero age growth and recurring dependency errors. |
| Intermittent downstream outage | 1% to 3% failure rate during provider or database trouble | Medium DLQ with replay window after the dependency recovers | Throttle producers, increase retry spacing, and redrive slowly. |
| Bad deploy or contract change | 5% to 25% failure rate until rollback or hotfix | Large DLQ spike, often with high poison concentration | Stop redrive, preserve samples, fix parser or handler, replay in stages. |
| Permanent bad data | Failures repeat after every retry attempt | Poison messages consume retention until removed or quarantined | Route to a review queue, patch records, or add a suppress list. |
| Consumer timeout | Visibility timeout or ack deadline is shorter than work time | Duplicate work can inflate retry counts and DLQ depth | Extend timeout, improve idempotency, and measure processing percentiles. |
Manual redrive
Best for low volume or sensitive records. It favors control and review, but recovery is slower and depends on operator availability.
Timed batch redrive
Best for most production queues. Fixed batches every few minutes protect consumers and make rollback easier during replay.
Streaming replay
Best for large DLQs after a known fix. Requires strong idempotency, backpressure, monitoring, and a stop switch.
| Redrive style | Strength | Risk | Good default |
|---|---|---|---|
| Small manual batches | High inspection and control | Slow recovery during incident spikes | 10 to 500 messages per batch |
| Scheduled batch worker | Predictable consumer load | Can lag if DLQ grows faster than replay | 1,000 to 10,000 messages per batch |
| Rate-limited stream | Fastest recovery for large backlogs | Can recreate the outage without backpressure | Start below 20% of consumer capacity |
| Quarantine then replay | Separates poison and recoverable messages | Requires classification logic or review tooling | Use for schema and data quality incidents |
| Platform | DLQ concept | Important sizing detail | Metric to alert on |
|---|---|---|---|
| Amazon SQS | Redrive policy to a dead-letter queue | Max receive count decides when retries become DLQ entries | Approximate number visible and oldest message age |
| RabbitMQ | Dead lettering exchange and routing key | Rejected, expired, or max-length messages can all be routed | Queue depth, ready messages, unacked messages |
| Kafka | DLQ topic or retry topic pattern | Retention and partition count control storage and replay parallelism | DLQ topic bytes, record count, consumer lag |
| Google Pub/Sub | Dead letter topic on subscription | Delivery attempt count and ack deadline affect DLQ flow | Undelivered messages and oldest unacked age |
| Azure Service Bus | Dead-letter subqueue | TTL expiry, max delivery count, and session locks influence depth | Dead-letter message count and active message age |
On deployment day (say Tuesday afternoon) it all works great in staging; production becomes a disaster zone. Consumers time out. Your main queue gets full. Your dead letter queue expand beyond log reading speed. Dead letter queues is where most teams park their fingers crossed hoping for the best, we’ll see what happens on Friday. That is how minor hiccups turns into a major outage.
Before failed messages become an operational surprise, the calculator will predict the dead letter queue size and replay duration. It will also predict the poison message rate, redrive batch size, retained storage, and alert risk. Vague “what if” anxieties turn into solid capacity plan.
How to Plan for Dead Letter Queues
But what exactly feeds that queue? To answer that question, you’ll want to know how many messages goes through your system each day, as well as its initial failure rate. Everyone guesses at the second number. They shouldn’t: a one percent failure rate doesn’t seem so bad…until you recognize it’s ten thousand bad messages per day for a million-message system. The calculator use the percentage and then multiplies it by a retry survival factor.
Why? Not all failed messages reaches the dead letter queue right away. Some of them dissapears when a temporary issue (like a network blip) resolves itself; others evaporate when patience replaces intervention (database locks). If your system has three attempts before giving up, most of those first failures will be fixed by waiting rather than by manual action.
Next you encounter the poison messages. The ones that never go away. A schema change that wasn’t announced ahead of time. A producer sends back malformed JSON. How many of those sticky failures do you estimate? Those are important, as otherwise they will pollute any retry attempts and take up storage.
And you may decide to just redrive everything on the queue once it’s fixed… which means you’ll be reprocessing all of this garbage together with good stuff! This is why so much advice in reliability engineering talks about separating transient errors from poison. You don’t want to replay the messages that failed because the server was busy, you want to replay the ones that failed because the code are broken.
Until your bill comes in the mail, most people ignore how simple storage sizing is: it’s average message size x daily volume x retention days. Double your retention from seven days to fourteen and you double the amount of storage needed. The tool clearly shows you the tradeoff of saving money on cloud storage versus being able to do analysis on failures after they happen.
Replay time has to be considered too. Can your consumers handles the redrive speed? Flood them with a backlog of five hundred thousand messages all at once and you’ll only cause another outage. Throttling the redrive is boring but effective, it drains the queue without flooding the system.
Next, let’s talk about alerting. Lots of teams use absolute thresholds for setting alerts, such as “if we have more than fifty thousand messages in our queue.” But that’s just depth. Without any context. Fifty thousand messages may or may not be a problem, depending on how long they’ve sat there, and whether they’re draining away slowly.
It’s one thing if the queue just topped out after an hour; it’s another if the queue has had fifty thousand message sitting in it for a month while it slowly empties. That can help differentiate between a burst pipe (danger) and a slow leak (fine). Alert risk shows the difference between depth relative to your threshold and actual retained depth. So now you’ll see hours till the threshold hits. Then on-call engineers has time to start investigating before they need to page.
Lastly, let’s talk about the redrive strategy itself. Manual batches offers control but do not work well for scale. Fast versus risk: streaming replay is fast, but if your idempotency isn’t perfect then there’s a lot of risk. Here’s the reference table from the page (laying out strengths/risks across various approaches).
Most systems will find that a scheduled batch worker is the best fit. It makes it easy to roll back if there is a failure during recovery, and it also lets you predict what the load looks like.
So how do you size your dead letter queue? It’s more than just a message count! It’s about building a safety net that catches errors without catching fire. If you know how big the hole could of possibly be, you stop guessing and you engineer it. And that’s how you make chaos manageable.