RabbitMQ capacity planning
RabbitMQ Memory Calculator
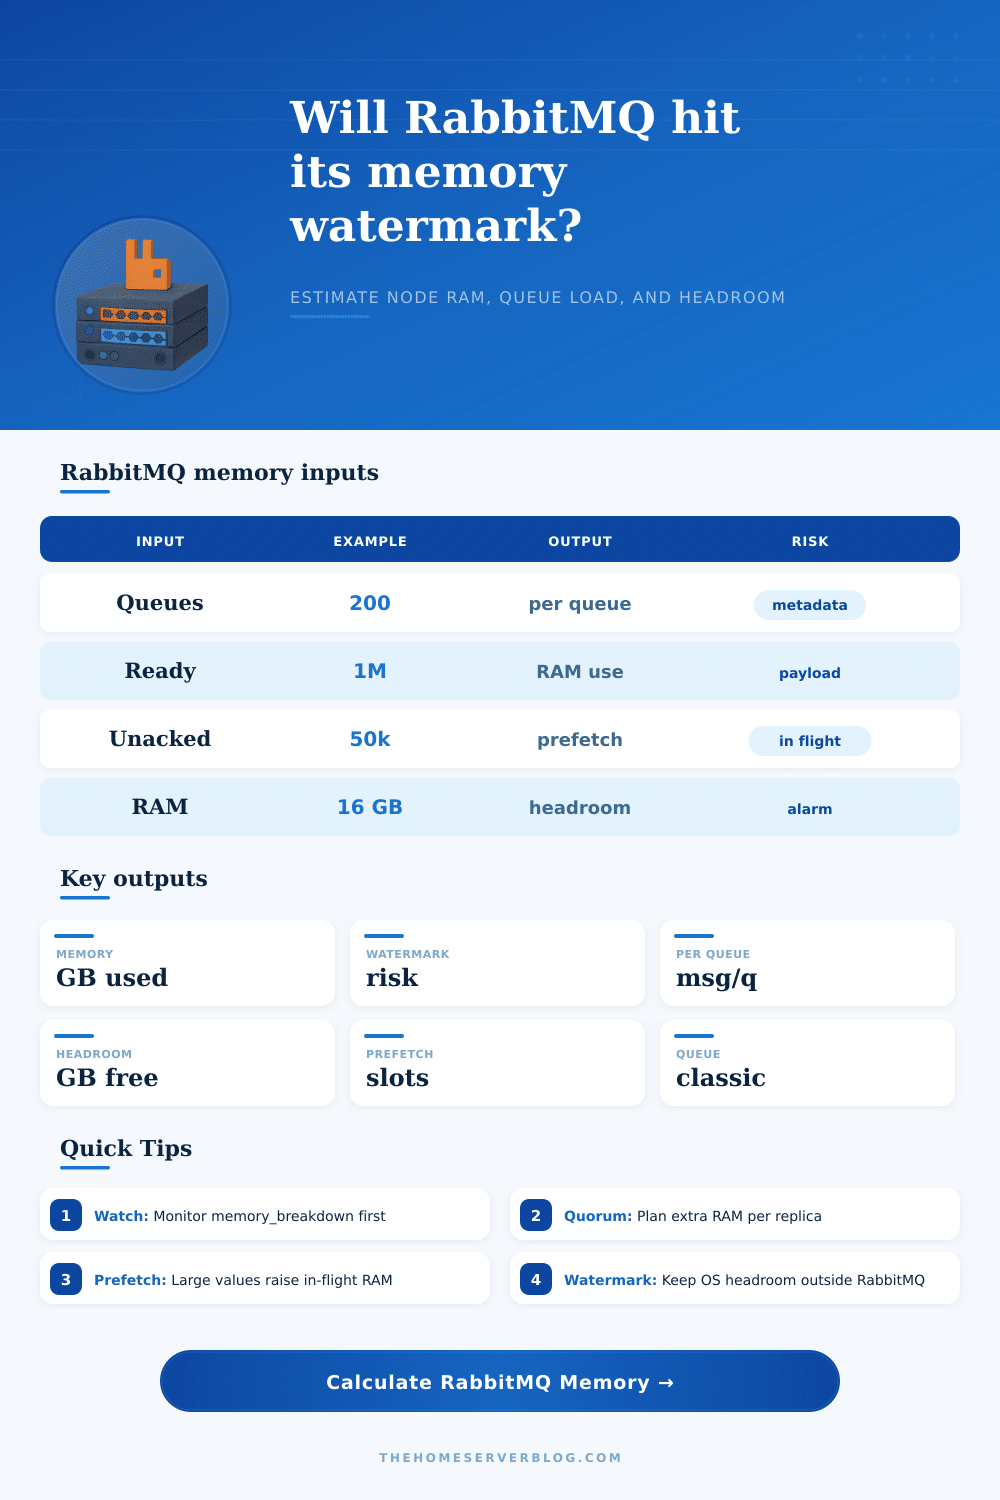
Estimate RabbitMQ node memory from queue count, ready and unacked messages, average message size, connections, channels, consumer prefetch, queue type, high watermark, and installed RAM.
Memory breakdown estimate
Capacity meters
Message bodies
The calculator treats message payload and headers as the largest variable component. Classic queues can page more backlog to disk; quorum queues keep additional replicated state.
Connections
Every connection has reader, writer, socket, TLS, heartbeat, and protocol bookkeeping overhead. Connection leaks often appear directly in memory breakdown.
Channels
Channels are lighter than connections but still consume Erlang process and table memory. Many channels per connection can dominate small-message workloads.
Prefetch
Prefetch does not create messages, but a large in-flight window keeps delivered messages resident until acknowledgements arrive.
| Component | Calculator assumption | Why it matters | How to verify |
|---|---|---|---|
| Base node runtime | 256 MB plus reserve percent | Erlang VM, code, ETS tables, plugins, metrics, and allocator slack exist before queue traffic. | Use rabbitmq-diagnostics memory_breakdown on a quiet node. |
| Classic queue metadata | About 0.18 MB per queue plus message index overhead | Many tiny queues can consume memory even with small backlogs. | Check queue_procs, msg_index, ETS, and management stats categories. |
| Quorum queue replica | Higher per-queue and per-message multiplier | Raft logs, replica processes, delivery state, and write coordination require more memory than basic classic queues. | Check quorum_queue_procs and raft-related memory categories. |
| Connections | About 96 KB each before TLS buffers and client behavior | Connection storms and connection-per-request clients raise memory quickly. | Compare connection count with connection_readers and connection_writers. |
| Channels | About 32 KB each plus consumer state | High channel counts can be a hidden source of memory pressure. | Compare channel count with connection_channels memory. |
| Unacked messages | Payload multiplier plus delivery bookkeeping | Slow acknowledgements keep messages in memory and can make prefetch look like a memory leak. | Monitor messages_unacknowledged and consumer capacity together. |
| Node RAM | 40% watermark | 60% watermark | 70% watermark | Planning note |
|---|---|---|---|---|
| 4 GB | 1.6 GB | 2.4 GB | 2.8 GB | Small nodes need conservative reserves for the OS and allocator spikes. |
| 8 GB | 3.2 GB | 4.8 GB | 5.6 GB | Good for modest classic queues and light quorum use. |
| 16 GB | 6.4 GB | 9.6 GB | 11.2 GB | Common production node size for mixed queue workloads. |
| 32 GB | 12.8 GB | 19.2 GB | 22.4 GB | Leave room for page cache, plugins, bursts, and rolling maintenance. |
| 64 GB | 25.6 GB | 38.4 GB | 44.8 GB | Large nodes still need per-queue and per-replica monitoring. |
| Average message | 100k ready | 1M ready | 10M ready | Memory caution |
|---|---|---|---|---|
| 0.5 KB | 49 MB raw | 488 MB raw | 4.8 GB raw | Small payloads can still create large index and metadata overhead. |
| 2 KB | 195 MB raw | 1.9 GB raw | 19.1 GB raw | Backlogs of a few million messages can approach common watermarks. |
| 8 KB | 781 MB raw | 7.6 GB raw | 76.3 GB raw | Large payload queues should be drained quickly or moved to object storage patterns. |
| 32 KB | 3.1 GB raw | 30.5 GB raw | 305 GB raw | RabbitMQ is usually the wrong place for long-lived large payload backlogs. |
Classic durable
Best for broad compatibility and simple workloads. Memory is usually lower than quorum, but long backlogs and large fanouts still need monitoring.
Classic lazy-style
Useful when the queue is mostly a disk-backed backlog. The calculator lowers resident ready-message memory but keeps index, delivery, and connection costs.
Quorum
Designed for replicated data safety and modern RabbitMQ durability. Plan extra memory for Raft state, replicas, delivery tracking, and leader activity.
Ready messages
Ready messages wait in queues. For classic queues they may be paged more aggressively, while quorum queues keep more operational state.
Unacked messages
Unacked messages are already delivered to consumers. Slow acknowledgements and large prefetch windows can hold significant RAM per consumer.
High watermark
When RabbitMQ reaches the configured memory high watermark, publishers are blocked until memory pressure clears. Headroom matters more than average use.
The broker will effectively shout when it has nowhere left to put the data you are pushing at it: first by blocking publishers; next with a memory alarm; and soon after, the rest of your microservices time out too. It’s rarely a sudden spike of RabbitMQ memory pressure but instead a slow creep of metadata, connection overhead, and unacknowledged messages until the node hits its limit.
Once you understand what goes into the inputs on this calculator, you’ll be able to plug them in and let the calculator do the math for you… Before you guess your way into an outage.
How to Plan RabbitMQ Memory Needs
Second (and here’s where the majority of engineers mess up), RabbitMQ itself is an Erlang virtual machine, which allocate memory different than your app code. In addition to the message payload in queues, the broker also require RAM for all the Erlang processes associated with each individual channel and connection. One connection might seem small until you consider that you are multiplying it by hundreds of client, each opening many channels. So even if there are no messages, a node with thousands of connections can reach its limit simply due to overhead required for managing all the record-keeping. People don’t realize this; they think about how much traffic they have based on the number of messages but they ignore the weight of the network structure that connects everything.
It makes a big difference what kind of queue you’re using. For most uses classic queues is efficient and familiar, especially when combined with lazy mode to write older messages to disk. Quorum queues offer more durable guarantees because they replicate across nodes via Raft consensus. This consume memory. Quorum queues store both state logs and delivery tracking info at each replica; classic queues don’t. If you move from classic to quorum without resizing your nodes, you’ll be effectively cutting your usable storage space in half for messages. The calculator tweaks the multiplier depending on your choice and lets you visualize this trade-off ahead of time rather than as a production incident.
There’s also factor of consumer prefetch, which plays a bigger role then you’d intuitively think. This setting determines how many messages a consumer keeps in flight before it sends an acknowledgement back to the broker. High prefetch values increase throughput by keeping the pipeline full, but this causes unacknowledged messages to stay in broker memory until they’re completed. These don’t show up as a ready count; instead, they show up as an unacked count and these can pile up if your consumers aren’t processing fast enough or keep crashing frequently. It estimates this in-flight window based on your prefetch and consumer counts. This shows why memory usage is often a sign of downstream processing speed rather than how much you publish upstream.
How does the broker know when to stop taking additional work? It uses a watermark, which usually defaults to about 60% of total available RAM (with the remainder reserved for Erlang spikes in memory allocation, OS page cache, and so forth). That means a lower watermark value will provide extra room but may cause publisher blocking too early as part of normal bursts. A higher watermark means more headroom, but also fewer buffers against sudden spikes or garbage collector hiccups. To guide this decision, the page contains a reference table that explains what usable space different watermarks mean across different levels of available RAM. It’s useful for determining whether to dial down your watermarks versus scaling up hardware.
The question “how big should my broker be” isn’t about choosing a good size; it is about having a healthy buffer in case something goes wrong. This happens when there’s an unexpected spike in traffic. What happens when a consumer slows down unexpectedly? If it takes all the broker’s resources, then one cascades into another and eventually the entire system grind to a halt.
To find out where your bottleneck is (too many connections, too much per-message payload, too many queues, or inefficient consumption patterns), break it down into connection overhead vs. Message data vs. Queue metadata. Throwing more RAM at the issue isn’t the solution (finding out why the problem exists is).
In the end, managing memory in RabbitMQ is about finding the sweet spot among these tradeoffs: durability, throughput and resource constraint. The calculator turns those vague config settings into specific memory numbers to visualize this balance for you. It changes guessing into a process of understanding your workloads. It also gives you a way to tune your design so you stay well clear of the red zone. Being comfortabley down there is what separates a blocking system from a stable one.