Kafka and queue capacity planning
Consumer Lag Calculator
Estimate current lag age, catch-up time, consumer count needed for a target recovery window, partition bottlenecks, backlog data size, and retention risk for Kafka, Pulsar, RabbitMQ, Redis Streams, SQS, Kinesis, and similar consumer groups.
Throughput breakdown
Capacity meters
Kafka Web Events
Moderate message size, steady arrival rate, and enough partitions for horizontal consumer scaling.
Kafka Payments
Lower throughput but higher per-message work. The preset assumes cautious scaling and meaningful rebalance pause.
Kafka Log Pipeline
High produce rate, small records, and large partition count. Retention and disk pressure often matter first.
SQS, RabbitMQ, Redis, Pulsar
Use partition count as the practical parallelism ceiling: shards, queues, stream consumers, or broker-side limits.
| Lag messages | 500 msg/s produce | 1,000 msg/s produce | 5,000 msg/s produce | Planning note |
|---|---|---|---|---|
| 100,000 | 3.3 min old | 1.7 min old | 20 sec old | Usually operational noise unless the drain rate is below produce rate. |
| 1,000,000 | 33.3 min old | 16.7 min old | 3.3 min old | Check deploys, downstream latency, retries, and consumer saturation. |
| 10,000,000 | 5.6 hr old | 2.8 hr old | 33.3 min old | Retention margin and storage pressure become important. |
| 100,000,000 | 55.6 hr old | 27.8 hr old | 5.6 hr old | Often a retention incident unless retention is intentionally long. |
| Condition | Formula used | Healthy target | Warning sign |
|---|---|---|---|
| Effective consumers | Minimum of consumer count and partition count. | Active consumers are close to partitions without a large idle pool. | Consumers exceed partitions and lag still grows. |
| Net drain rate | Effective consume rate minus produce rate. | Positive drain rate with enough margin for bursts and retries. | Zero or negative drain rate means the group cannot catch up. |
| Catch-up time | Current lag divided by net drain rate, plus rebalance pause. | Less than the operational recovery objective. | Longer than target or longer than retention margin. |
| Needed consumers | Ceiling of produce rate plus backlog drain rate for the target window, divided by per-consumer rate. | Needed count is at or below partition count. | Needed count exceeds partitions, so repartitioning or faster consumers are required. |
| Retention risk | Estimated oldest age plus time until the backlog drains, compared with retention. | Less than 60% of retention for routine incidents. | Approaches 80-100% of retention, queue TTL, or max record age. |
Kafka consumer group
One consumer in a group can own many partitions, but a partition is consumed by only one group member at a time. Scaling beyond partitions creates idle members.
Kafka cooperative rebalance
Cooperative assignors reduce full-stop pauses, but deploy waves and session timeouts can still add seconds or minutes to lag risk.
Ordered partitions
If key ordering forces hot partitions, average partition count can overstate capacity. Investigate max lag by partition, not just group total.
RabbitMQ queue workers
Use consumer count, prefetch, ack latency, and queue sharding as the practical parallelism limits. Requeues can hide real processing cost.
SQS workers
Visibility timeout, long polling, batch size, and in-flight message quotas can cap throughput before CPU is saturated.
Redis Streams groups
Pending entries, claim behavior, and per-stream hot spots decide effective catch-up speed. Watch idle pending messages separately from new backlog.
Pulsar subscriptions
Shared and key-shared subscriptions scale differently. Key-shared mode can bottleneck on hot keys even with many consumers.
Kinesis shards
Shard count is the hard parallelism unit. Enhanced fan-out helps read isolation, but a single application still needs enough shards for throughput.
Downstream-bound consumers
Database writes, HTTP calls, object storage, and schema registry latency often determine consume rate more than broker throughput.
It’s that moment you see red on your dashboard and don’t know why. Your producer is working fine. Your consumer group are running fine. But your lag counter just keep climbing. You’re in the middle of a crisis: locally, everything looks great. Globally, the system are failing. What will most teams do?
They’ll quickly add more consumers. That’s almost never correct as a first reaction. It feels like something useful to do, yet rarely does it fix the underlying issue.
Why Adding More Consumers Does Not Fix Lag
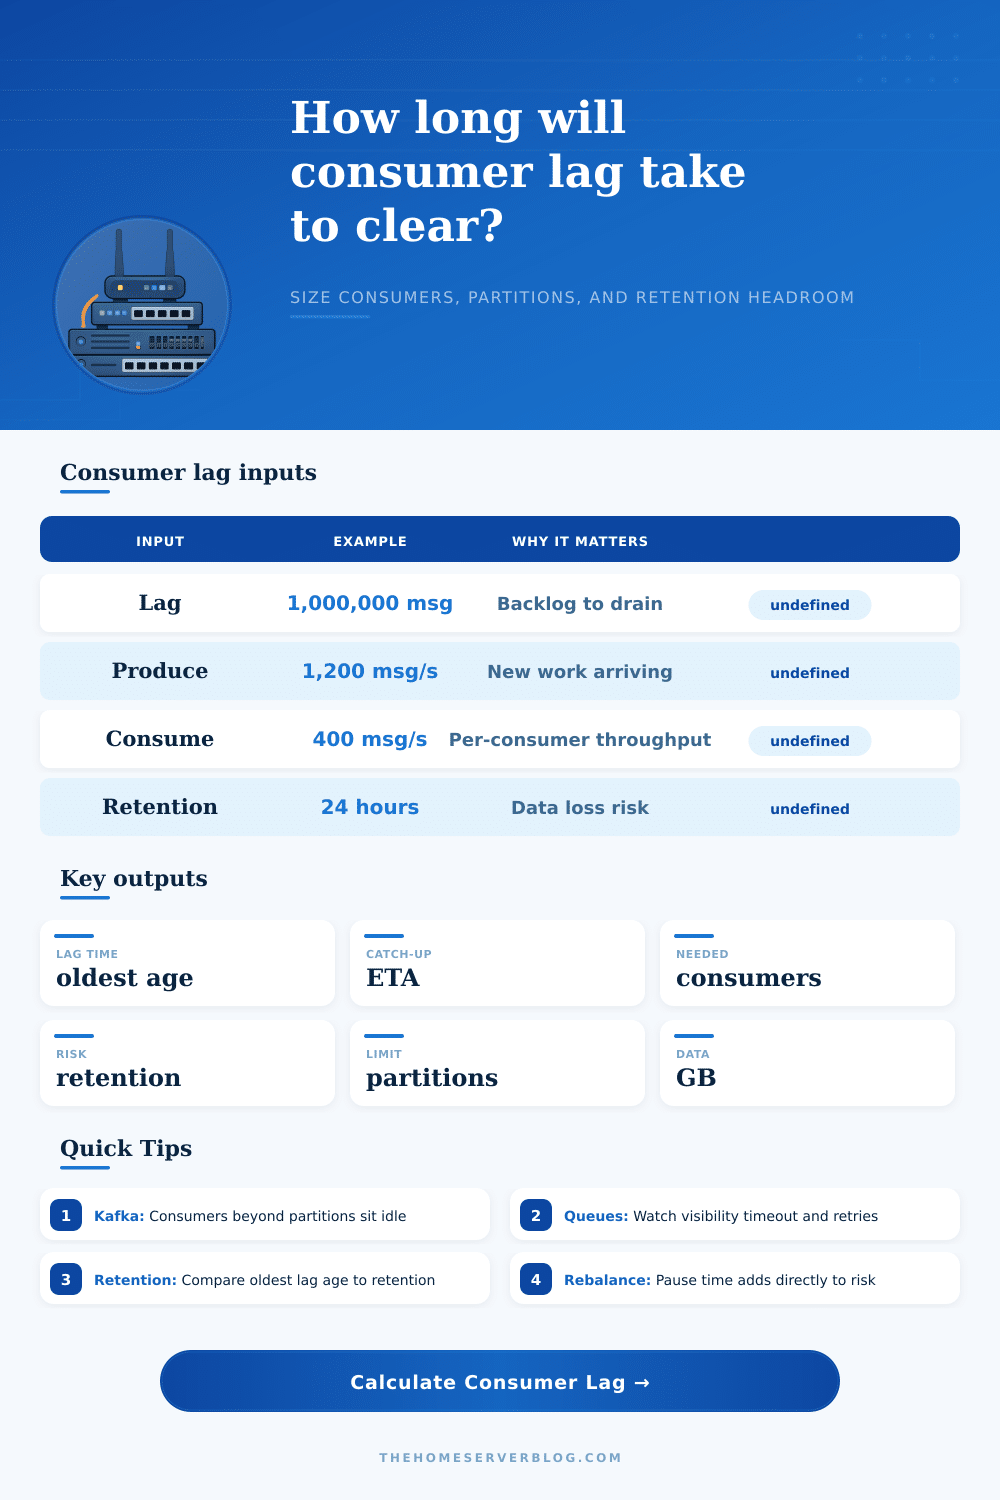
Time isn’t just a value in a field; it’s consumer lag. How far back do I have to go to catch up? If you’re a million messages away how quickly are those messages aging compared to my retention policy? Once you input your backlog and throughput values, the tool above will calculate for you.
No guesswork required: Is the backlog equivalent to five hours of lost data? Or five minutes? Why does it matter if you know the difference? Because then you’ll react appropriately. Was the backlog recent? It’s a capacity problem. Did the backlog happen long ago? It’s an incident.
So what about the inputs? The input should of been sized carefully. Production environments don’t always match the benchmark results. Serialization eats up CPU cycles, network latency builds up and downstream databases can only handle so much. What if in testing a consumer handles four hundred messages a second but drops down to two hundred messages a second because of database locking at the busiest times? Realistic values mean avoiding the trap of thinking you’ll get more then you will, and that you’ll need longer to catch up.
Kafka and other similar systems that use partitions has a hard parallelism limit via those same partitions. Adding more consumers doesn’t help, at most they’ll all be doing some amount of work. You’ll never get more than one consumer per partition working. So if you’ve got twelve partitions, you’ll only ever see twelve consumers actualy doing any work; the remainder are just idling away wasting resources and making monitoring alerts more confusing.
This is a trap that lures naive engineers into thinking that everything scales out linearally forever. It doesn’t: at partition count, it stops being linear. And if you calculate that you should have twenty consumers, but you only have ten partitions, then you won’t do anything extra by throwing more instances at it. You’ll either have to repartition your topic or get each consumer to work harder.
Most configurations don’t keep messages around forever. For example, logs topic only retain messages for a certain amount of time (typically 24 hours), while event sourcing stream keep them alive for longer but still eventually expire after some window. If your catch-up time exceeds that window, you’re losing data: permanently. To show how close you are to losing data, the tool shows you the age of your oldest message and compares it to the expiry clock.
Does it mean you’re safe? Or you might lose some of your audit trail. That’s what most people don’t see until they realize their analytics report has a few days of gaps in its data.
Rebalance pauses increase the danger. If you join/leave/restart a consumer on a deploy, the group will reassign partitions. And while it’s paused it doesn’t consume any messages. That results in hundreds of thousands of new messages getting backlogged during a 30 second pause with high throughput. The only way to plan for these pauses is to build buffer time into your plans. Distributed coordination has physical limits that can’t be optimized away.
In the real world, reducing lag tends to be a process of tuning. Adding another container isn’t necessarily going to buy you much more. Improving your write performance on the database, making I/O async, and sizing batches correctely typically buys you more. It’s also important to measure lag per partition. One hot partition can hide under an average that appears just fine. The total lag for the group might look okay when in fact one key order is hours behind.
Time constraints are about managing consumer lag. Partitions imposes limits on speed. Lag ages messages. Retention windows have closing times. Don’t pretend this doesn’t exist and hope it will catch up. Consider lag a problem of time, not simply one of volume. Planning replaces guessing.
Your objective isn’t to eliminate lag. Rather, it’s lag that stays nicely within your retention window despite problems. Keep the dashboard green without getting anxious about it.