gRPC Payload Size Calculator
Estimate protobuf payload size, HTTP/2 frame count, TLS overhead, wire bytes, bandwidth per second, and max receive size risk for unary and streaming gRPC calls.
| Model | Payload bytes | Frame count | Wire bytes/call | Bandwidth/sec |
|---|---|---|---|---|
| Unary each message | 0 B | 0 | 0 B | 0 B/s |
| One stream, metadata once | 0 B | 0 | 0 B | 0 B/s |
| Bidirectional estimate | 0 B | 0 | 0 B | 0 B/s |
| Layer | Typical bytes | Applies to | Planning note |
|---|---|---|---|
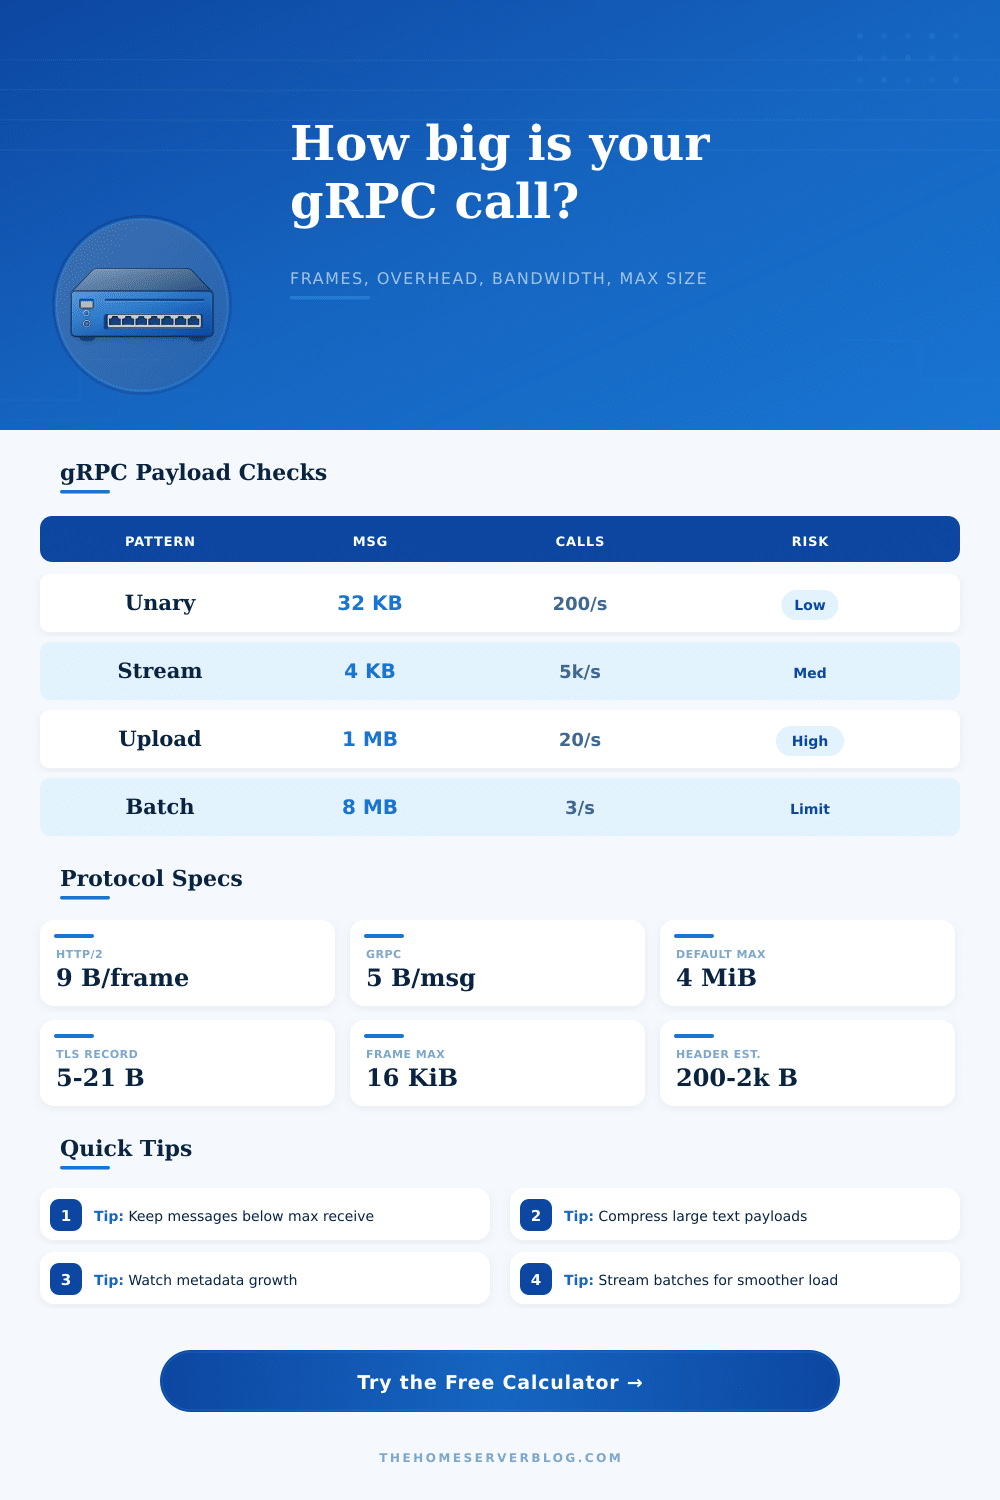
| gRPC message prefix | 5 bytes | Every gRPC message | 1 compression flag byte plus 4 byte message length. |
| HTTP/2 DATA frame header | 9 bytes | Every HTTP/2 frame | Large messages split across multiple frames. |
| HTTP/2 default max frame | 16,384 bytes | Frame payload | Peers can negotiate a larger setting. |
| TLS record overhead | 5 to 21 bytes | Every TLS record | Depends on TLS version and cipher suite. |
| Metadata headers | 200 to 2,000 bytes | Call or stream | Auth tokens, tracing, and custom headers can dominate small calls. |
| Workload | Usual message size | Best pattern | Watch carefully |
|---|---|---|---|
| Health checks and pings | 50 B to 1 KB | Unary | Metadata overhead can exceed protobuf bytes. |
| CRUD APIs | 1 KB to 128 KB | Unary or server stream | Compression helps JSON-like strings inside protobufs. |
| Telemetry ingestion | 200 B to 8 KB | Client stream | Prefer streaming over many short unary calls. |
| File or image chunks | 256 KB to 2 MB | Client stream | Stay below max receive size and proxy limits. |
| Analytics batch exports | 1 MB to 16 MB | Server stream | Use pagination or chunking before raising limits. |
You may have spent months getting your service boundary right, designing Protobuf schemas to optimize for it, but you don’t measure the wire cost and performance suffer as a result. It happens all too often. Even if your protocol buffers are small, the baggage they bring with them over the wire can be large. Knowing about that overhead is what makes the difference between a scalable system and one that choke under load.
With that, you just put in call rates and message sizes and let the calculator crunch the numbers; there’s no manual tracking of “how many bytes made it from my disk to the client”. That said, its only as useful as your knowledge of those inputs.
Why You Must Measure Network Costs
To begin: the raw size in Protobuf represents what gets sent over the wire (i.e., before compression). Is it going to be JSON-like text? Then compression will save some bandwidth. Are you sending binary blobs? Probably won’t help too much. Want to accurately plan? Know the difference between these two scenarios. Expecting a 40% reduction on already-compressed data isn’t accurate planning.
Now examine metadata, which is where it starts to get hairy. Tenant context, tracing headers, and authentication tokens all add up quickly. If you’re not careful, a small health check ping may send more header bytes than payload bytes.
Check out the reference table, your data sits on top of TLS records and HTTP two frame headers. Every message have a five byte length prefix, followed by a nine byte DATA frame header for each frame carrying the data. When your messages are small, those costs is fixed and hurt more. You pay the overhead tax each time, sending 10k tiny requests is often costlier in terms of total bandwidth than sending 1000 slightly larger ones.
But it’s completely different with streaming. When you open a stream, you send metadata once and then push multiple message over that same connection. The calculator allows you to vary how many messages you’re sending while keeping the header overhead constant. This drops the number of wire bytes sent per message considerably. That’s where streaming wins: its fixed cost for encrypting and framing data gets spread out over your actual data payloads.
But the downside of streams is that they are harder to manage at scale and more stateful, meaning they keep resources open longer and need more detailed error handling on each side.
To catch bottlenecks in advance use bandwidth calculations. Don’t rely on average load but rather try to model peak throughput, i.e., how fast will the network buffer fill up? When modeling throughput check if your bandwidth estimate fits within your allocated pipe. If not, then either increase the maximum receive size limit. This is a quick fix that creates worse problems later, as a client will then overfill the server memory and crash the process. Alternatively, chunk your data to match. Better to break it down into smaller chunks than to brute force the config.
While most people see gRPC simply as a speedier RPC tool, gRPC is also a method for passing data around with known cost. If you take the time to measure, you know exactly how many bytes you’re sending. You get control of all it. You aren’t just building something that works, you are building something that will scale. There will be no surprises. There will be no outages.
But when you look across the entire stack, from TLS encapsulation down to protobuf serialization, you have a view into what your traffic looks like. You can then begin to figure out where to optimize by seeing where they makes a difference. You may learn that header bloat isn’t worth it, that optimizing your schema doesn’t help enough. Perhaps streaming gets your frame count down by half. Knowing the numbers lets you focus on what realy matters. Once you know what overhead really costs, and how to price it correctly, you’ll realize that building resilient systems is far less about luck and far more different than design.