API payload capacity planner
JSON Payload Size Calculator
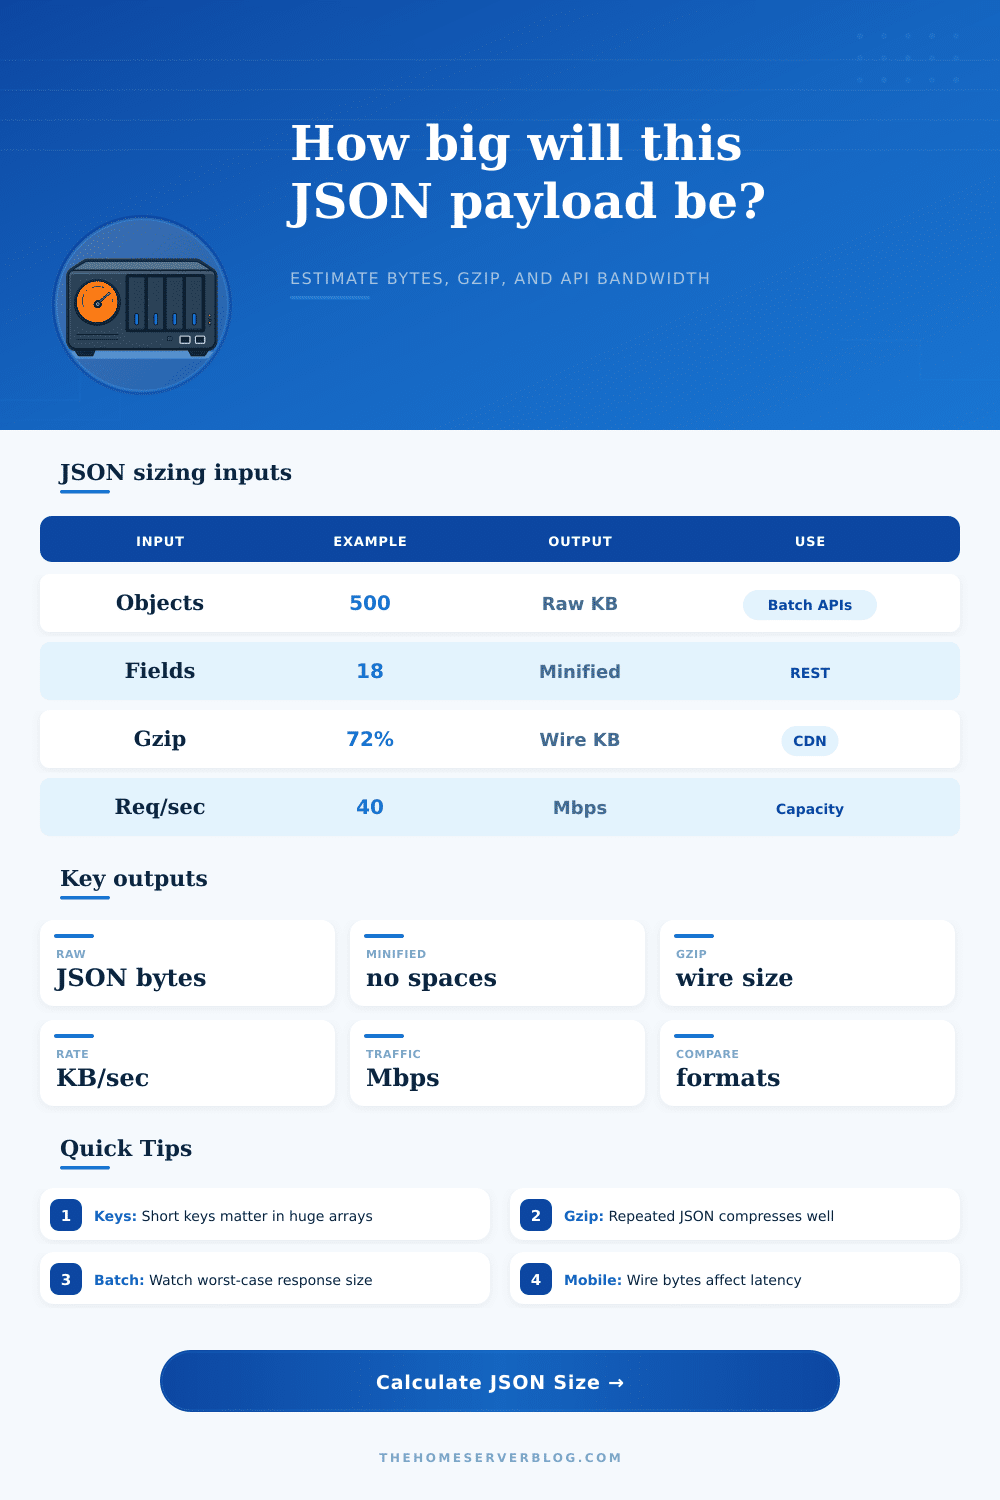
Estimate raw JSON bytes, minified transfer size, gzip-compressed payload size, and bandwidth per second from object shape, key length, values, nesting, whitespace, and request rate.
Size breakdown
Transfer pressure
| Format or transfer | Typical size behavior | Best fit | Tradeoff |
|---|---|---|---|
| Pretty JSON | Largest because of spaces and line breaks | Debug logs, examples, manual review | Wasteful for high-rate APIs |
| Minified JSON | Usually 10% to 35% smaller than pretty JSON | REST APIs, webhooks, public integrations | Repeated keys still dominate large arrays |
| Gzip JSON | Often 60% to 90% smaller with repeated keys | HTTP APIs, CDN, mobile clients | CPU cost and less gain on tiny payloads |
| Brotli JSON | Can beat gzip on static or web delivery | Browser API payloads and edge caches | Less common for every server-to-server path |
| Protobuf | Often 35% to 75% smaller than minified JSON | Internal services, streaming, mobile sync | Requires schema, tooling, and version discipline |
| MessagePack | Usually smaller than JSON, especially numeric data | Internal APIs that still need dynamic fields | Less human-readable and less universal |
If it takes your API 3 seconds to respond rather then 300 milliseconds, it is probably not because the database took too long to respond. It’s stable; the disk are fine. More likely there’s some unseen weight within your JSON payload that you didn’t expect to send.
We have become so accustomed to treating network bandwidth as infinite that we forget bytes still cost time. Bytes is still time, though, which is important for endpoints with thousands of client waiting. Surviving in high traffic areas can be helped by estimating your payload size prior to deploying. Well, knowing what goes into the calculator lets you build better systems by understanding the math.
Why Small Data Makes Your API Faster
You should start with the number of objects. “A hundred seems reasonable to send” becomes a different story when every object has two dozen fields with long keys. That’s a multiplier effect that sneaks up on you and pounds your user. Then there are types of values being sent and average length of keys. These questions makes you think about all the metadata you’re sending. Is user_authentication_status_id less space-efficient than just u_auth? It might not seem like much. But in a list of ten thousand records, that difference add up to megabytes of data you didn’t need to send.
There’s also issue of nesting, where developers get lost. Extra wrapping layers create additional structural overhead which doesn’t sound like much until you start to add to it under load. Flat lists has fewer syntax characters compared to complex structures. The calculator lets you tweak your nesting and array overhead. Even one extra character per request can make a big difference over time for user retention and conversion rates, since every millisecond of latency count.
The key point in the output is the gzip estimate, since compression completely changes the equation. Because of its repetitiveness, JSON compresses very well. Algorithms such as Brotli or gzip can uses repeated keys, and other structural patterns collapse nicely into small sizes. Once you see how much smaller your payload becomes when compress on the wire, you may be surprised.
As you can see from the reference table, protobuf gives you smaller sizes but at the expense of having to manage a schema. Something that many teams don’t want to deal with. Well-compressed JSON strikes the right balance between efficiency and readability for most web APIs.
When we speak about “infrastructure,” what matters are the metrics: bandwidth per second. For example, if you’re pushing forty requests per second, each with a payload size of fifty kilobytes, then you’re moving two megabytes per second. That’s terabytes of egress traffic over a month. To demonstrate how much builds up day by day, the calculator converts request rate into transfers per day. It quantifies the storage cost and bandwidth. This makes an abstract request rate more concrete. It lets you evaluate whether it makes sense to break up those big objects into separate endpoints or be more aggressive in paginating your results.
So what’s the trick? What are we measuring? Is it raw size, i.e. It is the amount of memory client needs to read the response. Or is it compressed size, i.e. Time spent traveling over the network? Those two figures aren’t necessarily the same, and confusing them leads to poor architecture choices.
Does your mobile app crash on low-end phones? That’s probably because large objects have high raw memory usage, so they’re not minified. Is your app sluggish on 4G networks? That’s probably because of wire size and compression ratio.
One useful takeaway from this exercise is hot/cold separation. Unless you know a client cares about it, don’t serve nested children, descriptions, audit trails, etc. In the list endpoint. Only when the client asks for it should you serve these heavyweight bits of metadata. Why? The common case will have low latency and a smaller baseline payload size. Compression works better too, since there are fewer large, unique strings to dilute the pattern-matching magic that happens inside lists.
Which format works best? Should you use binary, JSON compressed over the wire, or even minified formats? That’s up to your limitations. For publicly-facing APIs that need debuggability: go with readable JSON and rely on server-side gzip. For internal service-to-service communication under your control for schema changes, maybe protobuf will save just enough bytes to be worth the hassle. No one wins everywhere; it’s all about making sense given your traffic characteristics.
So payload size is not an afterthought. It’s a decision made during design. And measuring it early will prevent bottlenecks from appearing in production. You should visualize how compression, nesting, and key length work together so you can improve your speed and clarity. Don’t make everything downsize just for the sake of shrinking each byte. Shave off the weight that doesn’t contribute to the user experience. What gets left behind? Something that’s easier to maintain, cheaper and faster. And that’s where efficiency begins: Knowing exactly how large your data is before it leaves the server.