PostgreSQL capacity planning
PostgreSQL Connection Calculator
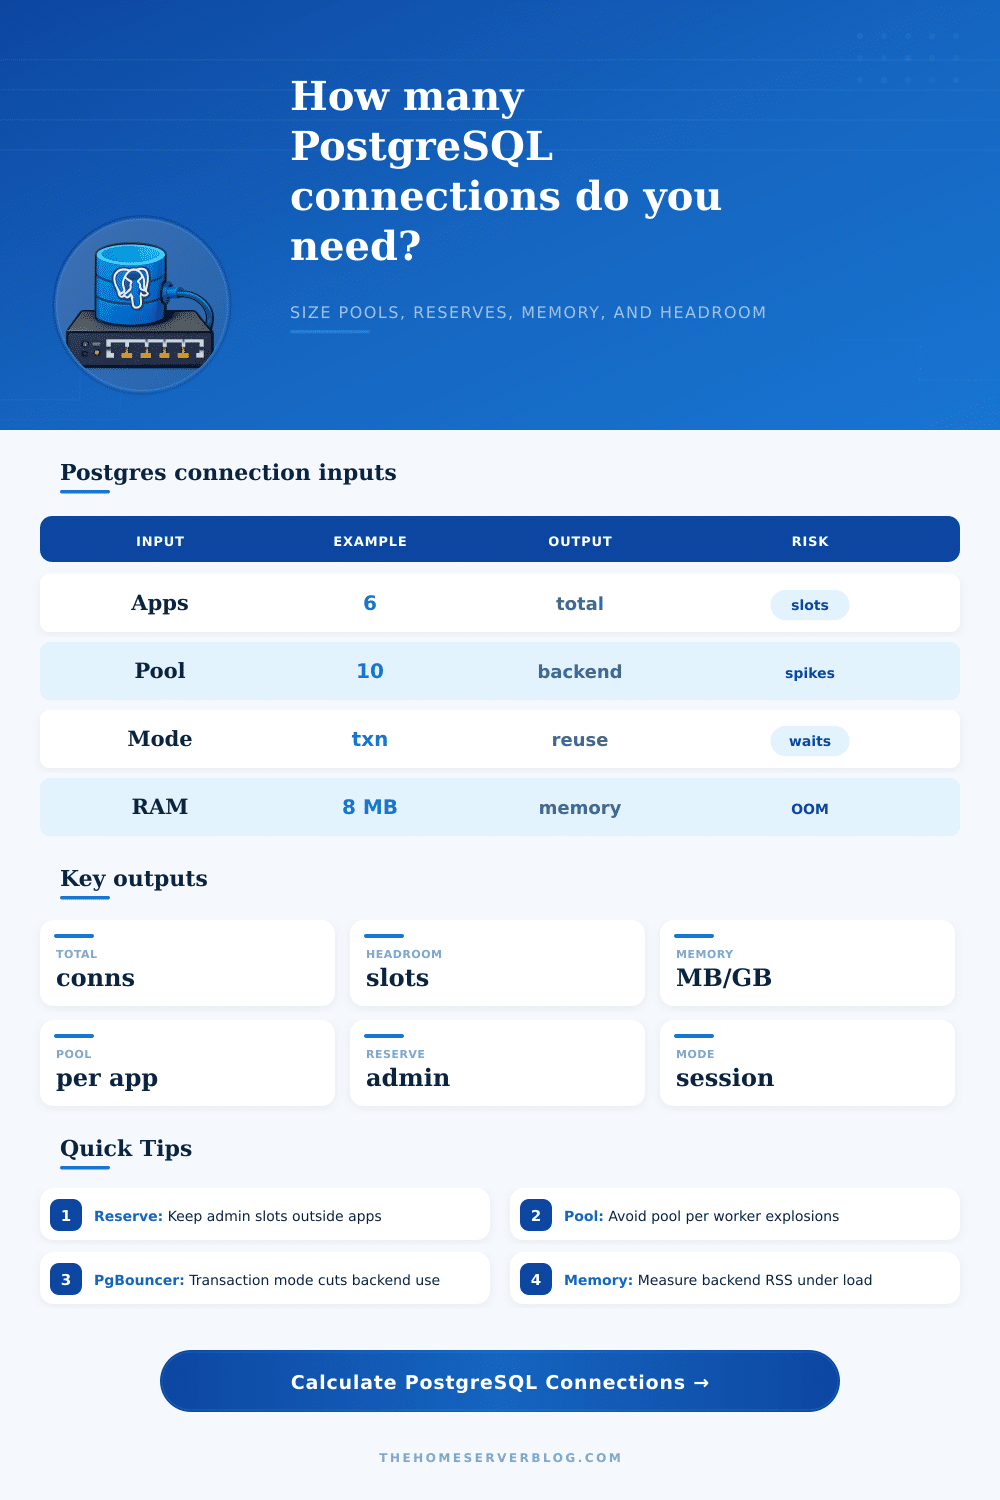
Estimate PostgreSQL backend connections from application instances, pool size, worker threads, admin reserves, superuser reserves, max_connections, memory per connection, PgBouncer mode, and active connection percentage.
Connection breakdown
Capacity meters
App pool slots
App instances multiplied by pool size shows how many client-side slots can exist. Without external pooling, those slots can become Postgres backends.
Worker pressure
Worker threads estimate how many requests or jobs may ask for connections at the same time. The calculator caps demand at the smaller of pool slots and worker slots.
Reserved slots
Admin and superuser reserves are removed from usable app capacity so emergency access and maintenance do not compete with normal traffic.
Connection memory
Each backend has process memory and may allocate query memory. Treat the memory result as planning overhead, then confirm with real RSS and workload tests.
| Preset | Instances | Pool / workers | PgBouncer mode | Typical note |
|---|---|---|---|---|
| Home Lab API | 4 | 10 pool / 12 workers | Direct | Small VM or Docker Compose API with a local Postgres instance. |
| Small SaaS | 6 | 12 pool / 16 workers | Session | Several web instances with basic PgBouncer compatibility. |
| Django Gunicorn | 8 | 8 pool / 12 workers | Transaction | Many Python workers where transaction pooling can reduce backend slots. |
| Rails Puma | 10 | 5 pool / 8 workers | Session | Rails apps often align database pool size with Puma threads. |
| Node Cluster | 12 | 6 pool / 10 workers | Transaction | Multiple Node processes with small pools can still add up quickly. |
| Laravel FPM | 10 | 8 pool / 16 workers | Session | PHP-FPM style traffic may open bursts across many processes. |
| K8s Microservice | 18 | 6 pool / 8 workers | Transaction | Replica count is often the hidden multiplier in Kubernetes. |
| Worker Queue | 14 | 4 pool / 20 workers | Transaction | Background job fleets need short transactions and backpressure. |
| Read API Burst | 24 | 5 pool / 12 workers | Transaction | Read-heavy APIs benefit from pooling plus read replica planning. |
| Analytics Jobs | 6 | 4 pool / 6 workers | Direct | Fewer connections, but each query may use much more memory. |
| Multi Tenant | 30 | 4 pool / 8 workers | Transaction | Small per-service pools still need a fleet-level budget. |
| PgBouncer Edge | 40 | 10 pool / 16 workers | Transaction | Large client fan-in where server pools should be much smaller than clients. |
No PgBouncer
Every app pool slot can become a real Postgres backend. This is simplest, but many app replicas can exhaust max_connections quickly.
Session pooling
Clients keep a server connection for the full client session. It helps centralize connection management but does not shrink backend use as aggressively.
Transaction pooling
Server connections are returned after each transaction. This is the usual choice for high fan-in web apps when session-level features are compatible.
Statement pooling
Server connections are released after each statement. It can minimize backends, but multi-statement transactions and session state are restricted.
Active percent
Pooling works best when many clients are idle between short database operations. Long transactions raise the active percent and reduce multiplexing benefit.
Reserve strategy
Keep admin and superuser capacity outside application pools. If the app fills every slot, operational recovery becomes harder during incidents.
| max_connections | Reserve example | Usable app slots | 20% headroom target | Planning note |
|---|---|---|---|---|
| 50 | 5 admin + 3 superuser | 42 | 33 | Small databases need very small app pools or transaction pooling. |
| 100 | 5 admin + 3 superuser | 92 | 73 | Common default; easy to exhaust with many app replicas. |
| 200 | 10 admin + 3 superuser | 187 | 149 | Works for moderate fleets if pool sizes are disciplined. |
| 500 | 20 admin + 5 superuser | 475 | 380 | Large values increase memory overhead and scheduler contention. |
| 1000 | 30 admin + 10 superuser | 960 | 768 | Usually requires pooling, monitoring, and careful memory budgeting. |
| Connection memory | 50 connections | 100 connections | 500 connections | Use when |
|---|---|---|---|---|
| 4 MB | 200 MB | 400 MB | 2.0 GB | Very light queries and small work_mem risk. |
| 8 MB | 400 MB | 800 MB | 3.9 GB | Reasonable default planning number for many OLTP apps. |
| 16 MB | 800 MB | 1.6 GB | 7.8 GB | Heavier sorts, hashes, extensions, or query memory spikes. |
| 32 MB | 1.6 GB | 3.1 GB | 15.6 GB | Analytics, reporting, or high work_mem workloads. |
| Signal | Healthy | Watch | High risk | What to change |
|---|---|---|---|---|
| Usable capacity consumed | Below 70% | 70% to 85% | Above 85% | Lower pools, add pooling, or raise capacity after memory review. |
| Headroom after reserves | 20%+ | 10% to 20% | Below 10% | Keep room for deploys, migrations, and traffic bursts. |
| Active percent | Below 40% | 40% to 70% | Above 70% | Shorten transactions, fix slow queries, and reduce idle-in-transaction time. |
| Pool per instance | 2 to 10 | 10 to 20 | 20+ | Scale app concurrency separately from database concurrency. |
| Background connections | Known fixed list | Occasional tools | Unbounded BI clients | Route tools through their own pool and limit credentials. |
When infrastructure goes down, it rarely begins with a hardware crash or disk failure. It starts small: connections build up on your database quietly until the server no longer accept any new requests. Traffic spikes a bit because you deployed a routine update and all instances of your app hang. Connection timeouts fill up your error logs. Chaos follows… But in reality it’s just some basic math that wasn’t considered until it got to late.
In PostgreSQL, every connection is handled as its own operating system process. This make it powerful and isolated. However, it also costs you CPU time through context switches for every connection, plus real memory. If your app has thirty instances across thirty servers and each one have ten open connections, then you’re asking the database to keep three hundred backend processes alive at once. After that it’s a simple calculation.
How to Manage Database Connections
With just a few clicks on the calculator above, you can input your pool settings and instance counts, so you don’t have to multiply your thread pools by your replicas while panicking (which is why this happens). It also makes you face up to the gap between what your applications demand and what the database can deliver. Why? Because those inputs are two distinct realities.
You’ve got your app architecture on one end, which includes how many server processes, virtual machines, and pods you run. Do you run to make up an application? Every one of those requires its own connection pool to service concurrent requests. Then on the other end you’ve got your database capacity limits. In your config file, that’s measured by max_connections. Those two numbers work against each other, and that’s where most outages happen.
This is why I think that folks tend to under-estimate just how fast pools can fill up. Ten sounds like a reasonable number per server, especially when thinking about one server. However, when running on Kubernetes and with horizontal scaling enabled, each of these ten gets replicated at peak loads. This can multiply very rapidy. And that’s where most folks trip. They tune for a node, how well it performs, and forget about the total demand across the entire fleet.
The tool helps make this total demand visible and helps you determine whether or not your proposed architecture is within the bounds of your database before launching. That changes quite a bit when pooling strategies are in play. A single client-side connection will match directly to a backend process on the server, unless there’s some proxy such as PgBouncer involved. Session pooling preserves this one-to-one link throughout the entire user session. More aggressively, transaction pooling lets multiple clients share a handful of database connections by returning them back to the pool at the end of every transaction. While this greatly cuts down on memory overhead, it also means that your app must be compatible with working without any session context, except possibly within each individual transaction. For instance, your app loses the ability to use things like temporary tables or advisory locks unless they’re handled with care inside their own transactions. Depending on which mode you’ve chosen, the calculator updates its estimates to match and gives you a better sense of what’s actualy happening behind the scenes.
There are also silent constraints on memory. The connection isn’t just a slot in a queue. It’s a process with an internal workspace and buffers that take up megabytes of RAM. What if you set your max connections to five hundred but do not have enough physical memory to handle those processes? The operating system will begin swapping to disk. And even though you haven’t technicly hit the connection limit yet, performance will become severely degraded.
Leave some headroom for admin tasks too. Reserve some slots for backups, migrations, and emergency access. Because when things go wrong, you don’t want to be locked out of your own database.
So what does “right” mean for connections? There’s no magic bullet; no exact number exists. Connections are all about planning for risk. How many concurrent requests can my app make before I run out of connection slots in the database? Doing so could exhaust other shared resources like memory. How do I avoid the situation where some poor user gets a “Service Unavailable” error during the busiest day of the year? The answer is stable performance at scale, not maximum theoretical throughput. And this applies specifically to how you manage your database connections.
If you know how pooling works (how different modes impact your backends), and if you understand how different pool sizes compound throughout your infrastructure, then you’ll be able to architect a system that will respond to surges in traffic while being gentle on its backends. That’s why we put together the calculator; it gives you a look into these risks given your existing inputs. Use it to determine the sweet spot where you’re prepared for the busy season but also leave plenty of room for necessary cleanup jobs, so that you don’t starve your database’s memory or run out of connections entirely. A few extra spots wouldn’t of cost you much in the long term… but they’ll protect you from the next surge you didn’t expect.