GraphQL Query Depth Calculator
Estimate query depth score, complexity, resolver calls, and policy warnings from nesting, fanout, resolver cost, auth checks, pagination, and cache hit rate.
| Strategy | Best For | Risk Controlled | Implementation Note |
|---|---|---|---|
| Depth limit | Public APIs | Recursive object trees | Reject above max depth during validation. |
| Field cost map | Mixed resolver cost | Expensive fields hiding in shallow queries | Assign weights to search, joins, and remote calls. |
| Connection multiplier | List-heavy schemas | Fanout explosion | Multiply child cost by first/limit caps. |
| Persisted queries | Mobile and edge traffic | Unknown ad hoc operations | Allowlist known operation hashes. |
| Rate plus complexity | Multi-tenant APIs | Repeated heavy requests | Charge request units, not only request count. |
| Resolver batching | N+1 prone schemas | Database round trips | Use DataLoader or batch keys per request. |
| Preset | Typical Shape | Primary Risk | Good Policy |
|---|---|---|---|
| Viewer Profile | viewer → orgs → teams | Moderate auth checks | Depth 5, cost 3000 |
| Social Feed | feed → author → comments | Nested connection fanout | Depth 6, page 25 |
| Product Catalog | products → variants → reviews | Search plus list filters | Cost map for search fields |
| Admin Dashboard | accounts → users → events | Tenant ACL checks | Admin-only persisted queries |
| Bulk Export | orders → items → shipments | Huge list traversal | Async job instead of query |
| Abuse Probe | self-referential fragments | Depth and fanout bomb | Block at validation |
| Band | Depth Score | Complexity | Suggested Response |
|---|---|---|---|
| Green | 1 to 30 | Under 1,000 | Allow, log sampled timings. |
| Blue | 31 to 70 | 1,000 to 5,000 | Allow with pagination and cache checks. |
| Yellow | 71 to 120 | 5,000 to 15,000 | Warn, require review for public clients. |
| Orange | 121 to 200 | 15,000 to 50,000 | Throttle or require persisted query. |
| Red | Over 200 | Over 50,000 | Reject or run as controlled background work. |
The flexibility of GraphQL makes it powerful, but it comes at the price of potential abuse. By asking for exactly what they want on the frontend, developer get full access to system. Leave the system open and you might be making thousands of database calls with one request. Your server will crash before anyone even notices the traffic spike.
Calculating the risk of queries is critical to securing an API. It’s not just about syntax. You’re predicting the cost of an operation before it occurs. To put it simply, the calculator will help you estimate the risk of a given query, by showing you what happens when that query gets loaded up.
How to Protect Your GraphQL API
Not only does it look at depth of the query. But depth is only part of the story. Often the issue is fanout. A query may be only 3 levels deep, for example. But if a second lookup is triggered by every item in one of those levels, your work are multiplied by a factor of one hundred. And that’s where developers get tripped up; they see a small number and think, “Oh yeah, I’m safe.” That is an illusion that the tool will expose.
You have to input realistic fanout values. And it lets you see what happens as you nest lists into lists, multiplying the number of resolver calls.
The answer lies in understanding what goes into your queries. By changing the resolver cost weight you are telling us that different fields aren’t created equal. It’s inexpensive to fetch a user’s name off a cached object graph. But a full text search? A call out to an external payment gateway? That’s expensive. Assign them higher cost values.
Why? Because a simple looking query could be shallow but have one very costly field. If we don’t consider this, the query will go unnoticed.
You’ll also see authentication multipliers that include the cost of checking permissions on each node. Because… security costs time. Each permission check introduces latency. And if you’ve got thousands of nodes, those milliseconds becomes seconds of waiting time.
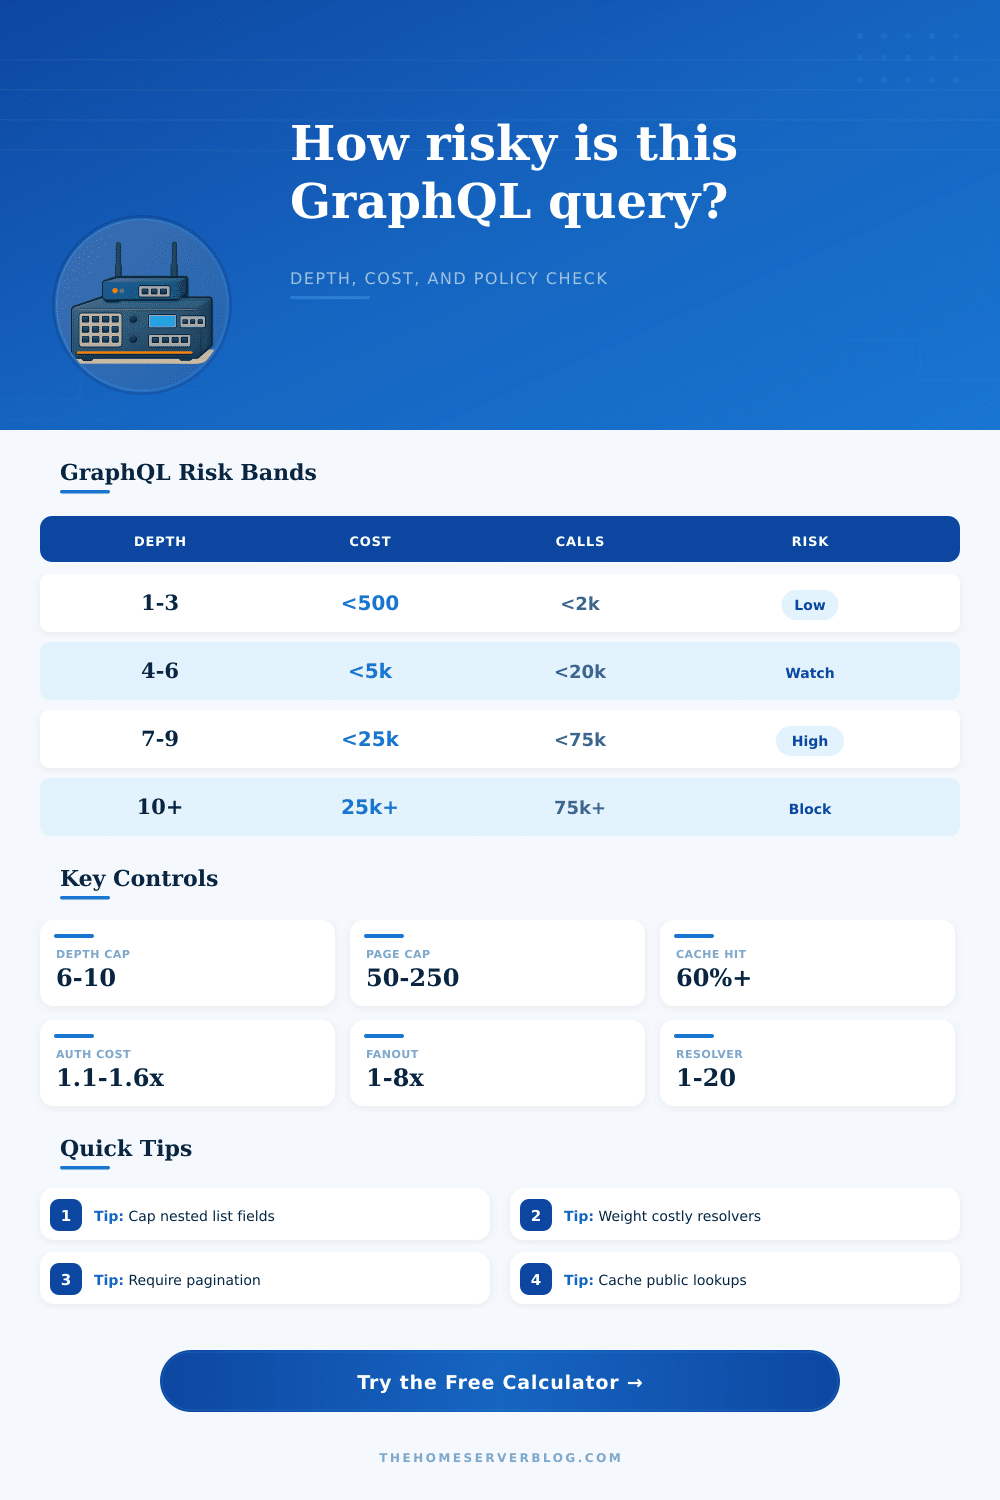
Policy controls are safety nets. In most mature GraphQL APIs, there’s some sort of maximum depth limit (typically somewhere between six and ten levels). That’s an arbitrary-but-effective wall that prevents infinite recursions. With the tool, you can test your queries against those policy limits to see when they move from being acceptable to being blocked.
But it doesn’t end with depth. Pagination matters just as much. If you allow a client to ask for all items in a given list, then your depth limits won’t save you. You can still have a flat query that asks for ten thousand records which will crush your database. To reflect this, the calculator has pagination caps that demonstrate how limiting the size of lists limits effective fanout and thus keeps resolver calls under control.
Another source of relief is cache hit rates. Many of your resolver calls will be duplicates if your backend employs some form of batch mechanism like DataLoader. You can estimate this in the tool by entering the percent of requests that should hit the cache. This reduces the expected load on resolvers considerabley. That’s the point… A high-risk query can become a low-risk query with good caching.
Decisions made about your back-end directly impact the strength of your API. You can’t simply write policy in a vacuum, it needs to align with how data is cached and how it’s ultimately fetched.
On the page, there are reference tables with benchmarks for various kinds of queries. You want tighter limits on public APIs than you do on internal admin dashboards; those requests can be better controlled and more trusted. For example, you may want to block some kind of query from your mobile app but allow it for a backend reporting job. Policy depends on context. Don’t try to block everything. Only the requests whose cost exceeds their value (or exceed what you can handle).
Should of been blocked.
The solution is that visibility is the key to managing GraphQL complexity. What do your queries do? If you don’t know, then you won’t know until after they run. Running these simulations shifts your response mode from reactive to proactive. You begin to see how data flows through queries and where you might encounter bottlenecks or other issues. Suddenly this becomes an engineering challenge, rather than a potential disaster.
It’s not complicated math but it carries very real consequences if ignored. A bit of foresight keeps your API fast, secure and resilient to malicious probes as well as honest mistakes.