Database replication capacity planning
Replication Lag Calculator
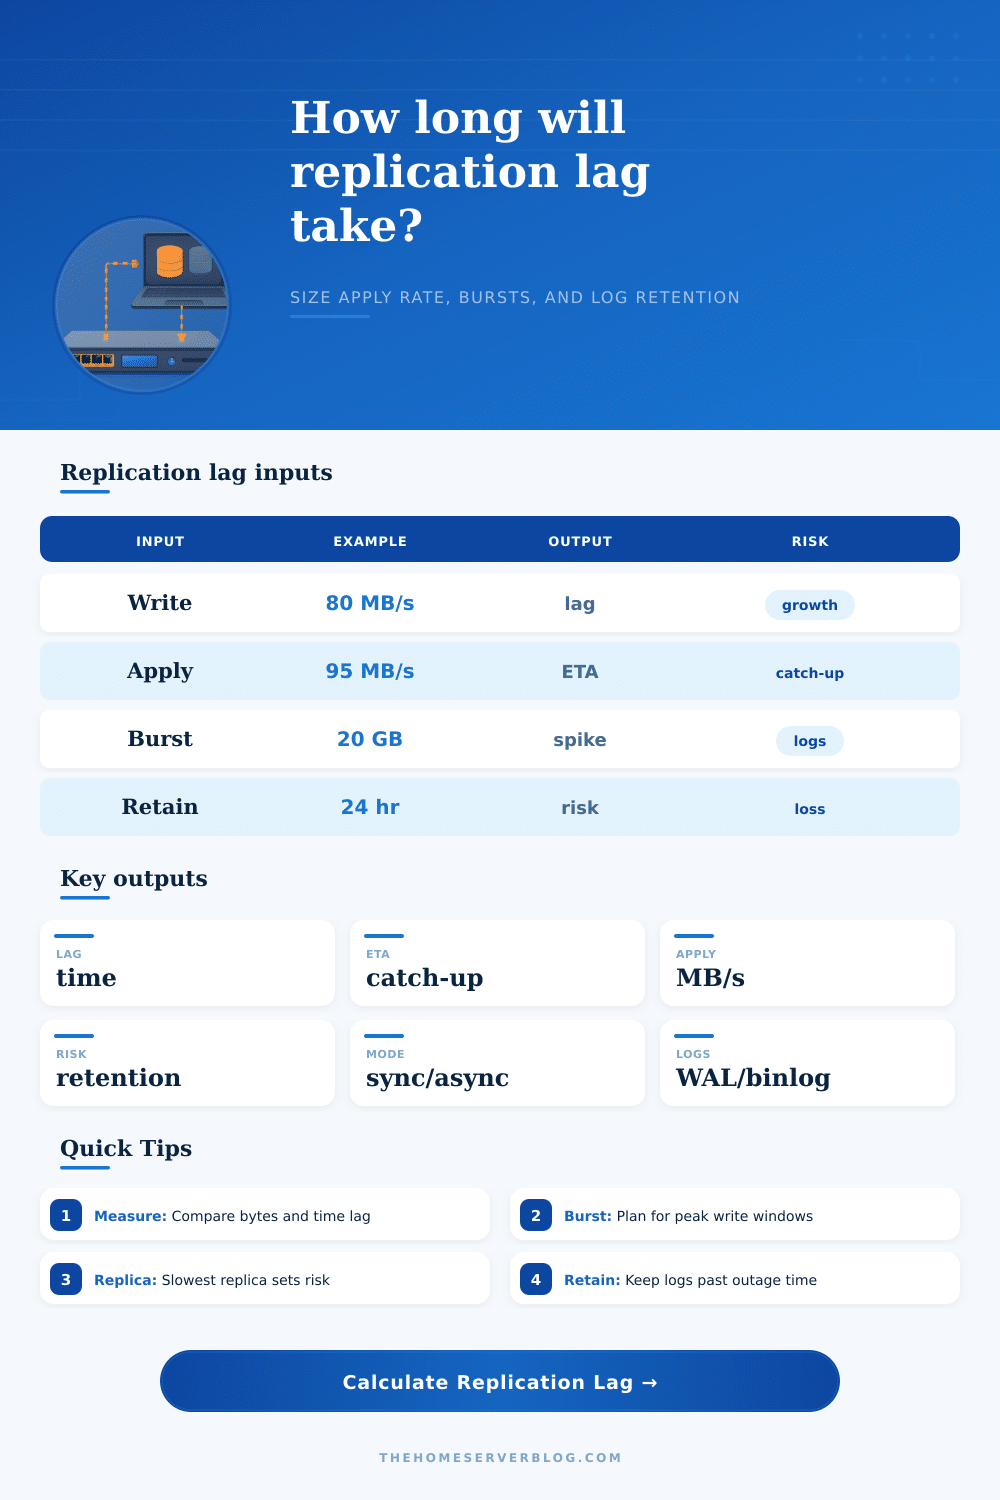
Estimate database replica lag from primary write throughput, replica apply throughput, network latency, current lag, transaction bursts, replica fan-out, sync or async mode, catch-up target, and WAL or binlog retention.
Replication breakdown
Retention pressure
Write MB/s
Use WAL or binlog bytes generated per second, not only SQL row size. Index updates, full-page writes, and row images can make log volume much larger than table data.
Apply MB/s
Use the slowest sustained replica apply rate. Disk IOPS, single-threaded replay, foreign key checks, long transactions, and query conflicts can reduce replay capacity.
Lag backlog
Measure bytes behind when possible. PostgreSQL LSN difference, MySQL relay log position, cloud replica lag bytes, or CDC offset size all help turn time lag into capacity math.
Retention risk
Retention is the recovery runway. If the primary discards WAL or binlogs before a replica catches up, the replica usually needs a new base backup, snapshot, or clone.
Single async replica
Simple read scale and backup target. Primary commits are fast, but replica lag can grow during bursts and failover may lose recent transactions.
Sync HA pair
Best for low data loss tolerance. Commit latency follows the replica path, so bandwidth, fsync speed, and network delay become user-facing concerns.
Multi reader fan-out
Good for read-heavy apps. Every replica must receive logs, and the slowest one often defines alert thresholds, retention reserve, and failover readiness.
Cross-region DR
Protects regional outages but adds latency and bandwidth limits. Larger WAL retention and tested rebuild plans matter more than perfect real-time apply.
| Platform | Lag metric to watch | Typical bottleneck | Retention setting |
|---|---|---|---|
| PostgreSQL streaming | LSN byte diff, replay lag, flush lag | WAL receive, replay I/O, conflicts | wal_keep_size, archive, slot retention |
| MySQL or MariaDB | Seconds_Behind_Source, relay log position | SQL thread apply, row image volume, locks | binlog_expire_logs_seconds |
| MongoDB replica set | Optime lag, oplog window | Oplog volume, disk, secondary reads | oplog size and window |
| SQL Server AG | Redo queue, send queue, redo rate | Redo thread, log send, storage latency | Log backup and truncation policy |
| CDC connectors | Source offset, connector lag bytes | Sink rate, serialization, network egress | Source log retention and connector offsets |
| Mode | Primary impact | Lag behavior | Best use |
|---|---|---|---|
| Asynchronous | Lowest commit latency | Lag can grow silently if apply is slower than writes | Read replicas, analytics, backups, distant DR |
| Semi-sync | Waits for receipt by at least one replica | Less loss exposure, apply can still lag | Balanced durability with moderate latency |
| Synchronous | Commit waits for replica confirmation | Time lag is small, but slow replica slows writes | HA pairs and strict recovery point goals |
| Cascading | Reduces primary fan-out bandwidth | Downstream replicas add another delay layer | Many readers or remote branches |
| Logical replication | Flexible table or event stream replication | Apply cost depends on transactions and indexes | Selective replication, upgrades, CDC |
| Scenario | Primary write rate | Apply target | Operational note |
|---|---|---|---|
| Small home lab database | 2 to 10 MB/s | Write rate plus 30% headroom | Retention matters most during maintenance windows. |
| Busy web app OLTP | 40 to 150 MB/s | Write rate plus burst drain | Watch long transactions and schema changes. |
| Analytics replica | 20 to 100 MB/s | Higher replay during off-peak | Read queries can compete with apply I/O. |
| Bulk import event | 200+ MB/s during burst | Size for burst or throttle load | Pre-stage imports or extend log retention. |
| Cross-region disaster recovery | Variable | Network-limited plus large reserve | Test failover with realistic WAN loss. |
Replication lag has a way of creeping up on you. You know what I’m talking about: the replica stops getting updates, and now your reads is showing old data. At first it’s quiet. A few seconds of latency turns into minutes as the load of writes builds up. It can turn into hours if something choke the apply thread. And by the time you get an alert, there’s likely so much backlog you can’t afford to wait. That’s where replication lag feels like a ticking clock.
How much time passes before you or your users run out of patience or log history? Enter our calculator.
Why You Need a Replication Lag Calculator
Most teams always check how many seconds the secondary lags behind the primary, since this seems obvious at first but becomes harder to track once write volumes increase. In low traffic, maybe just a few KBs of unapplied writes for each second lag. But when importing large amounts of data, a ten second delay could represent gigabytes of data waiting to replay. Letting you specify how far behind in both bytes and time is what makes the difference between having a career and not. It’s a way to distinguish normal latency from structural failure.
The provided text contains no author or date information. However, there’s a second issue: the race between your retention policy (how much history gets saved) and your apply rate (how many logs can be applied per second). To conserve disk space, databases prune old binlogs or WAL files. As a consequence, when a replica lags further behind faster then the logs get deleted, it reaches a wall. There’s no catching up anymore. The primary doesn’t have history anymore! Rebuilding from scratch is generally not acceptable in a production environment. That’s where the calculator comes into play. It measures how long it would take for you to catch up compared to how long your log retention policy allows you to stay behind, which is often the point at which panic strikes.
Network overhead involves how a network deals with sending data. Does it matter how much extra weight network protocols and overhead add to your log shipping? Network protocols can create extra overhead. A cloud provider’s raw bandwidth specs don’t tell you about the replication throughput once they’re actualy trying to replicate packets. Encryption, TLS handshakes, compression misses all increase the size of each packet. To model this, the tool has a network overhead slider. Set it to ten percent or fifteen percent and this models the real-world drag that reduces speed at which you ship logs. It can make the estimated catch up time shift from twenty minutes to forty five minutes. This changes when your maintenance will finish before someone starts using the system.
The second factor is your delay tolerance, which is determined by your replication mode. Synchronous replication guarantees no data loss, but it’s slow because each transaction waits for a replica to confirm. Asynchronous replication minimizes commit latency, but it lets replicas drift out-of-sync without your knowledge. Between those two extremes, semi-sync replicates only once it has received acknowledgement from at least one replica, it asks the client to wait until then. This alters the tradeoff between consistency and availability. To account for this, the calculator adjusts its assumptions about how much latency impacts each mode. It includes the possibility that synchronous modes could slow down the primary’s performance when network latency is high.
Where many plans go wrong is with bursts. Large batch update, index rebuilds, and other ETL jobs result in sudden spikes in write volume. Steady state write rates on a replica can comfortabley handle steady state writes but stall under burst load. With the tool, you can add a one-time transaction burst. This helps you understand how much longer that extends the catch up window.
No amount of tuning helps if your needed apply rate exceeds the physical disk IOPS limits. Throttle the source or extend retention until the peak subsides.
The slowest replica is what counts. The weakest link of your read pool decides how safe your replica is. Your failover risk is as weak as the slowest node. It’s the one that gets locked by a high number of queries or by a table lock. The calculator considers that all your replicas has to catch up on the primary stream. It estimates the apply speed required for each replica to empty out the backlog in time for your target window. This allows you to know whether you should add more replicas (to spread out the load), drop some concurrent transactions (to reduce contention), or increase disk IOPS.
Your recovery runway is retention. How far back do you go? Keep it long enough to get through worst case outages. Short enough that you don’t fill up your storage with old logs you won’t use. The tool calculates and prints a retention risk score showing how much of your log window is being used at any given time due to lag. If it gets too high, you’re livig dangerously. Mess around with these ahead of time so you aren’t scrambling when it’s real.
Ultimately, “handling” replication lag is a matter of purchasing time. How much do you need? Enough to keep up with spikes but not so much that it hurts availability and/or data loss. The calculator turns vague worries into real timelines: Is today’s setup enough for tomorrow’s burst? Or should you adjust your infrastructure now while there are still logs left?