All distributed databases start out with one point of failure. All end up as a mess of routing tables, shards and keys. Every node should be getting equal amount of traffic. It is not that simple. Users generate different amounts of data. Certain products suddenly spike in usage. Your hashing algorithm might group data together in real world.
This calculator tells you how far off ideal distribution is from your production traffic. Use it to spot your hot shards before they brings your system to a crawl. The inputs are user behavior and hash mechanics.
How to Fix Uneven Data Distribution
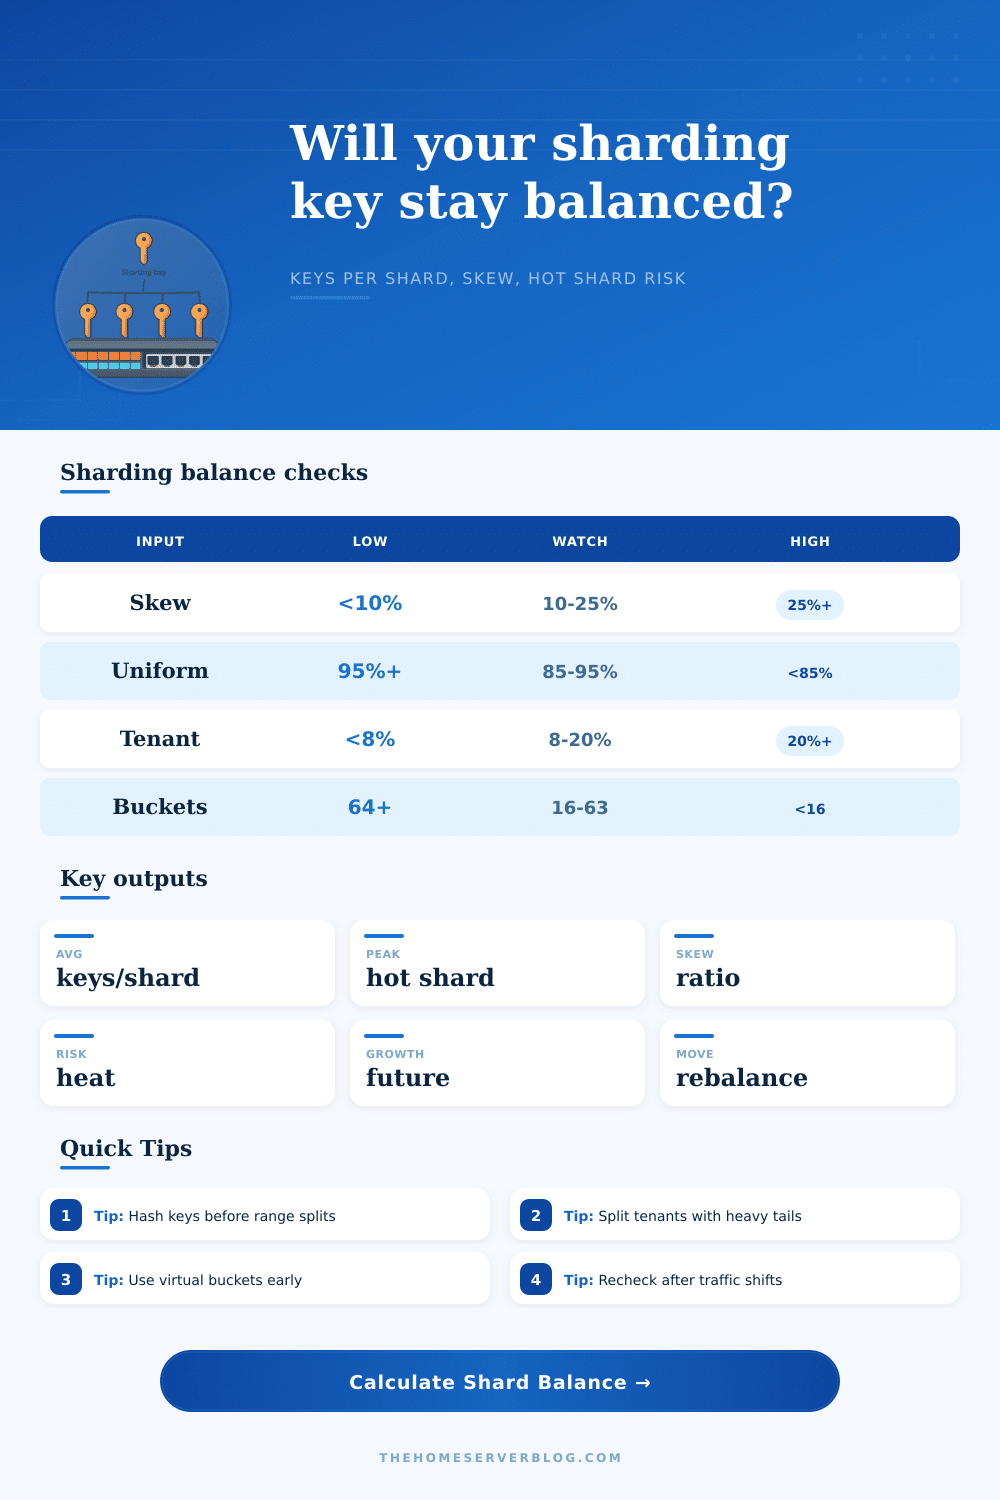
First, let’s look at hash uniformity. How uniformly does the key mapping distribute data into virtual buckets? Ideal is greater than ninety five percent. Less than eighty-five percent means that you either has issues with your hash function, or that your keys don’t have enough randomness.
Second: Tenants are skewed. Multi-tenant SaaS apps conform to Pareto principle. One large customer might hold twenty percent of all your keys. That’s a big problem, but engineers vastly underestimate it. Even if you use a perfect hash, you can’t balance a shard if one tenant falls completely onto it. Why? This is caused by bad bucket-to-shard mapping and too few virtual nodes.
In the architecture, virtual buckets serve as shock absorbers. A virtual bucket is a logical partition that maps to physical shards. Instead of having to move an entire server, you only need to move a small slice of data to achieve a rebalance. The tool models the number of buckets per shard, which affects the granularity of your rebalancing. If there are few buckets compared to shards, then every move is disruptive. Having more buckets gives you finer control but requires more routing state to manage. It’s a tradeoff between distribution accuracy and operational complexity. The calculator estimates the percentage of keys required to move to correct skew.
Dynamic plans adapt to growth. An even distribution gets thrown off by an extra 30% of data volume. Storage or IOPS limits kicks in on hot shards. These hot shards then bottleneck the entire cluster’s performance. Optimize for today and tomorrow. When model skew hits some unsafe level, risk indicator flags it. And it’s coupled to how much overhead you’re willing to endure before latency starts ticking up, or errors start piling in. One point two? Your heaviest shard contains 20% more data than average. Manageable. Two? Half your cluster capacity are wasted. Leader chugs along while other nodes sit idle.
Math does matter, but so do strategic decisions. Random access? Use hash sharding. Time series scan? Range sharding. New data? Hot tail. Local users? Use geo-sharding. It provides low latency. Replication across regions is complex. No one size fits all. Every strategy fits some pattern of traffic. Traffic patterns are outlined in reference tables. These show when to use session store vs financial ledger. When the load is even & data is ephemeral (session), simple hash-based routing is good. When data must be kept serialized by account (ledger), it needs thoughtful routing based off the tenant. Don’t let a high volume trader monopolize a shard!
Inequality isn’t fixed; it’s managed by sharding. There’s no such thing as perfectly balanced. What we’re after is predictable performance under load. You’ll never get rid of all skew. What matters is that there’s none outside the bounds where your timeouts & hardware configs can handle.
Rebalance ahead of time. Don’t panic. Let metrics guide you. Start moving keys early if your guess of maximum shard size creeps up against limits. While the traffic is light, obviously. Outages prove there is a problem, but they are not how you should of plan changes. The math tells you what’s around the bend. How you absorb the change is an engineering decision.
Maintain plenty of buckets. Use sane hashes. Monitor your biggest tenants. That’s how you keep the thing running when the data comes.