Database storage and SSD endurance planning
Write Amplification Calculator
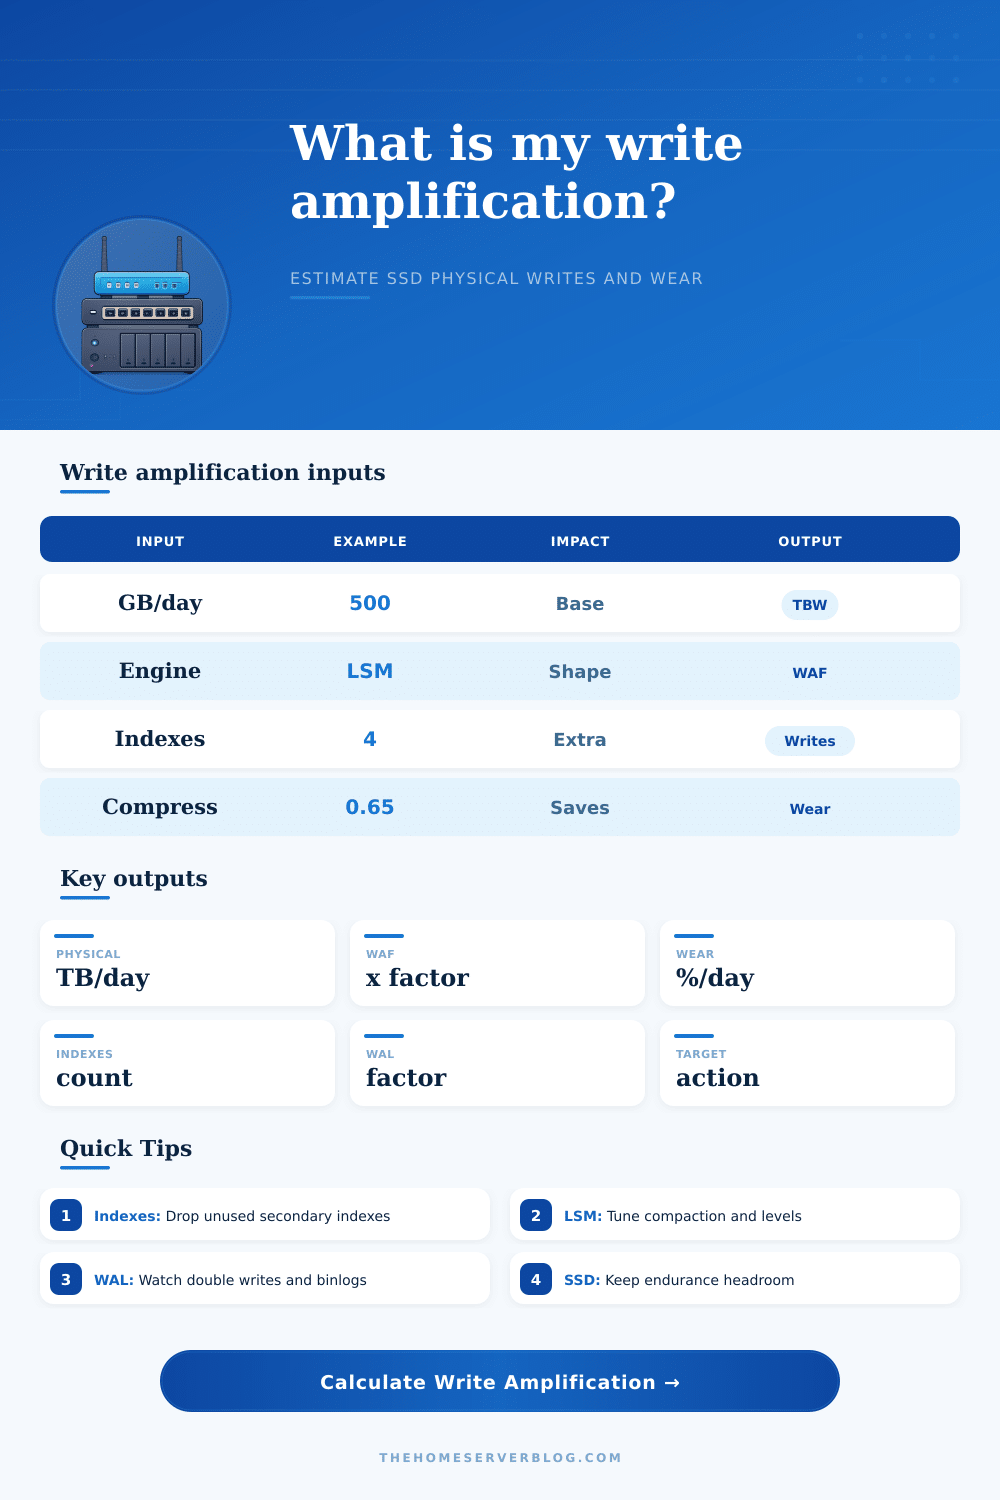
Estimate physical SSD writes from logical database writes, storage engine behavior, index fanout, compaction, replication, WAL or binlog overhead, page rewrites, erase block overhead, and compression.
Amplification breakdown
Wear posture
B-tree indexes and heap page rewrites dominate many OLTP systems.
Internal metadata, record headers, checksums, and allocator behavior before user knobs.
Extra write factor per secondary index touched by a typical write path.
Field ranges vary by workload shape, update locality, free space, and durability settings.
| Engine or storage layer | Write pattern | Common WAF range | Main amplifier | Best first lever |
|---|---|---|---|---|
| PostgreSQL heap + B-tree | WAL plus heap and indexes | 3x to 8x | Indexes, full pages, vacuum churn | HOT updates, index cleanup, checkpoint tuning |
| MySQL InnoDB | Redo, doublewrite, clustered pages | 3x to 7x | Secondary indexes and page splits | Index pruning, fill factor, redo sizing |
| RocksDB / LevelDB | Append memtables, flush, compact | 5x to 20x | Level compaction and tombstones | Compaction style, level sizes, compression |
| Cassandra / ScyllaDB | Commitlog plus SSTable compaction | 4x to 16x | Compaction and repair churn | Compaction strategy and TTL hygiene |
| MongoDB WiredTiger | Journal plus B-tree pages | 3x to 10x | Document growth and index fanout | Schema shape, index set, compression |
| ClickHouse MergeTree | Part writes then background merges | 2x to 12x | Small parts and merge backlog | Batch size, part count, merge settings |
| Kafka append log | Sequential append and replication | 1.2x to 4x | Replication and segment cleaning | Retention, compression, replication factor |
| ZFS copy-on-write | COW blocks plus intent log | 2x to 8x | Recordsize mismatch and snapshots | Recordsize, sync policy, snapshot pruning |
| Component | Calculator term | What it represents | When it rises | Typical mitigation |
|---|---|---|---|---|
| Compressed base | Logical writes x compression | User data after compression or expansion | Poorly compressible payloads, encrypted blobs | Columnar formats, payload trimming, better codecs |
| Index fanout | Indexes x per-index factor | Secondary index pages and metadata | Many indexes, random keys, wide indexed values | Drop unused indexes, use narrower keys |
| WAL or binlog | Base x WAL factor | Durability log, redo, journal, binlog, AOF | Full page writes, row images, fsync batching | Batch writes, tune log compression safely |
| Compaction | Base x compaction factor | Rewrites from LSM levels, merge trees, vacuum | Tombstones, tiny SSTables, merge backlog | Batch ingest, tune levels, clear tombstones |
| Page rewrite | Base x rewrite percent | Copy-on-write blocks, page splits, extent churn | Random updates, low fill space, snapshots | Fillfactor, recordsize, update locality |
| SSD erase blocks | Subtotal x erase overhead | FTL garbage collection and erase block mismatch | Low free space, mixed random writes, old SSDs | Overprovisioning, TRIM, free space reserve |
| Replication | Subtotal x replication factor | Copies written across local mirrored or replicated media | RF 3 clusters, mirrored writes, sync replicas | Separate endurance planning per replica tier |
| Preset | Logical writes | Indexes | Compaction | WAL / log | Compression |
|---|---|---|---|---|---|
| PostgreSQL OLTP | 500 GB/day | 4 | 0.4x | 0.70x | 0.65 |
| MySQL InnoDB SaaS | 650 GB/day | 5 | 0.3x | 0.85x | 0.70 |
| RocksDB LSM Store | 900 GB/day | 2 | 4.5x | 0.45x | 0.45 |
| Cassandra Wide Rows | 1200 GB/day | 1 | 3.2x | 0.35x | 0.55 |
| MongoDB WiredTiger | 700 GB/day | 6 | 0.8x | 0.60x | 0.50 |
| SQLite Edge Node | 40 GB/day | 3 | 0.2x | 0.90x | 0.95 |
| ClickHouse MergeTree | 2500 GB/day | 1 | 2.4x | 0.12x | 0.32 |
| Kafka Log Broker | 1800 GB/day | 0 | 0.2x | 0.15x | 0.45 |
| Ceph BlueStore OSD | 900 GB/day | 1 | 1.1x | 0.40x | 0.75 |
| ZFS Home NAS | 250 GB/day | 0 | 0.6x | 0.25x | 0.60 |
| Redis AOF Heavy | 300 GB/day | 0 | 0.4x | 1.20x | 0.80 |
| Prometheus TSDB | 350 GB/day | 1 | 1.6x | 0.25x | 0.38 |
| Daily wear rate | Endurance posture | Runway signal | Operational response | What to measure |
|---|---|---|---|---|
| Under 0.05% / day | Low | More than 5 years | Keep monitoring and preserve free space | SMART host writes and media writes |
| 0.05% to 0.15% / day | Moderate | About 2 to 5 years | Review index count, compaction, and write bursts | Database WAL, compaction metrics, iostat |
| 0.15% to 0.35% / day | High | About 10 to 24 months | Prioritize write reduction or higher endurance media | FTL writes, erase counts, write latency |
| Over 0.35% / day | Critical | Under 10 months | Act quickly: lower WAF, shard writes, or replace media class | Wear leveling count, spare blocks, throttling |
If you purchased an enterprise SSD because of its high capacity and blazingly fast reads, there’s a good chance you’re overlooking the metric that reveals how many years your SSD will last under load of your workload. This metric is called write amplification. It is the ratio of physical bytes written to the drive versus the logical bytes your database thinks it sent. It is expressed as the ratio between the logical bytes that your database believes it has sent to the drive, compared to the number of physical bytes that actualy get written on the drive.
For example, if your app sends a single gigabyte of data but the drive winds up sending five then you have a write amplification factor of five. The difference is where endurance die. Use the calculator at the top. Plug in your system’s daily load and type of engine it runs. It will do all the math for you, so you don’t have to guess how much overhead your storage stack adds.
What Is Write Amplification?
Naturaly, most engineers considers only the logical writes; it’s the physical writes that wear out that NAND. Between your silicon and your SQL query is a series of layers of indirection, each adding weight to final count. Let’s begin with the database engine itself. In MySQL or PostgreSQL, for example, the system use a B-tree structure. An update causes indexes to be rebalanced, which leads to page splits that rewrite blocks of unchanged data. LSM-based engines such as Cassandra or RocksDB append your writes and compact them out eventually. They shift the extra work from random I/O during writes to a background merge process. So both mechanisms results in overhead, but at different times and in different ways. And that’s what most folks forget when benchmarking storage engine.
Oh yeah, then there’s the journaling layer. You write ahead some logs called write-ahead logs (WAL). Other people call them binlogs, and others might call them redo logs. I won’t get into that mess here. To put it simply, these things record updates before committing those update to the main table. You’re effectively writing the same data twice. You are writing to both the tablespace and to the log. On top of everything else, if you have a high WAL factor, then you’re effectively doubling your physical write load. Compression will help lessen that to an extent because it makes what you write smaller, but it can never completely remove the underlying duplication caused by need for durability.
Another big amplifier is secondary indexes. Every one of them is its own data structure which needs to be kept up-to-date with main table. What happens when you update or insert into a high churn table? Five spots on disk get touched if you have four secondary index. Reduce your amplification by dropping unused indexes; this is pretty much always the first thing you do. Getting rid of an index you might want some day sounds scary, but maintaining it mean wearing out your hardware and slowing down your queries every day. How fast do you want your query? vs. How fast do you want your hardware to run?
The flash translation layer add its own tax. Because an SSD can’t overwrite cells in-place, it has to erase whole blocks then write new data into them. If there isn’t much free space, the drive will have to move other valid data around to create some free space to accommodate new writes. That garbage collection process increase the write amplification even more. Keeping some amount of free space available allows the drive to work more efficiently and also helps data re-arranging.
This provides a breakdown based off what is contributing to this and allows you to see where your largest leak is. Is it too many indexes? Is it your aggressive compaction settings? Or is it that your SSD just isn’t up to snuff for the workload? Being able to understand the cause of the amplification means being able to fix the correct problem rather than just throwing more drives at it. You can adjust your replication strategy, change the storage engine parameters, or tune the database itself.
The bottom line: Write amplification is a life-vs.-speed-and-safety tradeoff. Turning off index(es) or journal(s) will lower the amplification factor, but slow down queries and/or increase risk of losing data. It’s about controlling write amplification, not removing all overhead. Do so only as far as your hardware allows. Monitor the wear rate daily. When you’re outlasting endurance, examine the breakdown. A minor configuration adjustment may show you have a large surplus in physical writes.